
China Growth Tilting for a Value Market


One of the key debates going into this year has been whether the bloodletting in emerging markets and sharp downdraft in China could turn around in 2019.
WisdomTree’s asset allocation committee increased exposure to emerging markets in a number of our model portfolios for 2019, recognizing that it would be difficult for emerging markets to turn around without a China trade deal, but the valuations in many markets already accounted fairly well for the risks.
Many value-sensitive investors may agree. In China, for example, the last time we have seen valuations this depressed was in early 2016 (see second chart below).
Below, we highlight this market—China—where we believe a growth-tilted approach toward large tech companies is a smart way to add exposure.
Growth for a Value Market?
Many in the U.S. have been surprised by how strong growth indexes have performed over the last decade compared with value indexes. One reason growth performed so well is because, a decade ago, relative valuation multiples became so compressed that earnings growth of growth indexes powered the returns higher over lower-multiple, value stocks.
We think the same setup is occurring in China right now.
The WisdomTree China ex-State-Owned Enterprises Index has a tilt to growth companies and is trading at a higher price-to-earnings (P/E) multiple than the MSCI China Index. But we think that multiple is warranted.
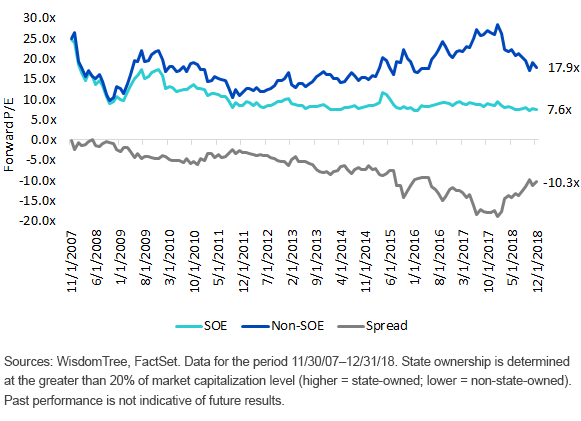
Let’s first compare the P/E ratios of state-owned enterprises (SOEs) and non-SOEs across time.
There were not that many of these newer tech giants in public markets a decade ago, so there was not much difference in the average P/E ratios across SOEs and non-SOEs.
As more tech companies went public, we can see the P/E ratio gap start to widen. Currently, the SOEs have single-digit forward P/E ratios at 7.6x, while the non-SOEs are 10 multiple points higher.
The maximum spread between SOEs and Non-SOEs was around 18x more, when SOEs were at 8.8x and non-SOEs were 27.2x in July 2017—so there has been a lot of valuation compression in the non-SOE segment over last 18 months.
Forward P/E of MSCI China SOEs and Non-SOEs (11/30/07–12/31/18)
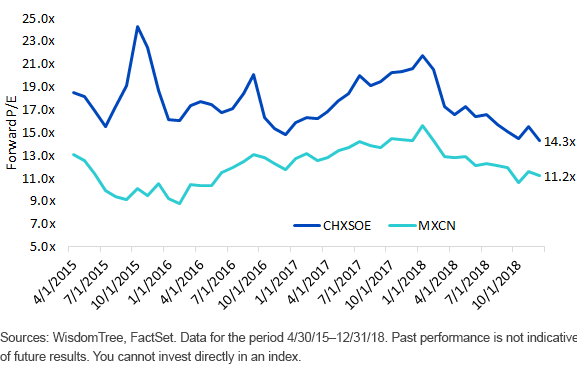
When we translate these segments into the P/E ratio of our China ex-SOE Index compared with the MSCI China Index, the gap narrows to about 3 points and 11.2x for our Index versus 14.3x for the MSCI China Index. This is one of the smallest gaps in P/E ratios since we launched the Index almost four years ago.
Forward P/E of WisdomTree China ex-State-Owned Enterprises Index and MSCI China Index (4/30/15–12/31/18)
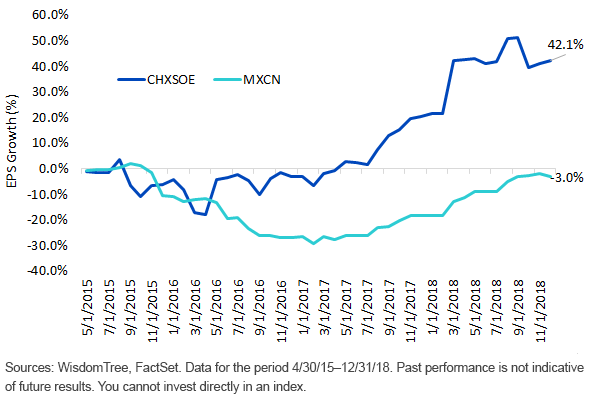
We know companies in the SOE universe are growing slower than the non-SOEs. The question is: what is the warranted premium P/E multiple? That is a hard question to answer, but the spread may be more than warranted when looking at the relative change in earnings across the two indexes.
When you look at cumulative earnings growth of the two indexes over the last four years, the traditional MSCI China Index has shown zero earnings growth—hence its lower multiple—while our ex- SOE Index has grown earnings over 40% since its inception, based on trailing 12-month earnings figures.
Cumulative EPS Growth (%) of the WisdomTree China ex-State-Owned Enterprises Index and MSCI China Index (4/30/15–12/31/18)
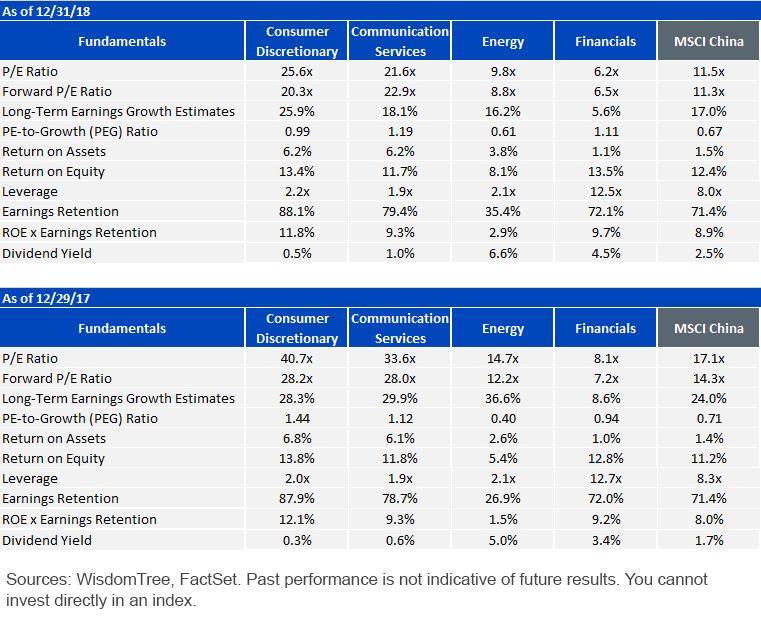
SOEs are heavily made up of energy and financial companies, while the non-SOEs are more tech- and consumer-oriented. These companies tend to have significantly greater earnings growth expectations.
Now, expectations for China tech and consumer stocks may still be unreasonable, and financials that are perennial concerns may be priced right at single-digit P/E ratios and 4.5% to 6% dividend yields, and they could be great value plays.
Our high-dividend value strategy owns many of these Chinese value companies.
But for a 3-point-higher P/E multiple expressed above, with the tilt to companies growing earnings at faster clips, I think a Chinese tilt to ex-state-owned enterprises reflects an interesting opportunity to capitalize on the most hated asset class of 2018.
Fundamentals Comparison Across Sectors of MSCI China: Year-End 2017 and Year-End 2018
Share & Comment
Popular Posts
Categories
Related Links
Jeremy Schwartz has served as our Global Chief Investment Officer since November 2021 and leads WisdomTree’s investment strategy team in the construction of WisdomTree’s equity Indexes, quantitative active strategies and multi-asset Model Portfolios. Jeremy joined WisdomTree in May 2005 as a Senior Analyst, adding Deputy Director of Research to his responsibilities in February 2007. He served as Director of Research from October 2008 to October 2018 and as Global Head of Research from November 2018 to November 2021. Before joining WisdomTree, he was a head research assistant for Professor Jeremy Siegel and, in 2022, became his co-author on the sixth edition of the book Stocks for the Long Run. Jeremy is also co-author of the Financial Analysts Journal paper “What Happened to the Original Stocks in the S&P 500?” He received his B.S. in economics from The Wharton School of the University of Pennsylvania and hosts the Wharton Business Radio program Behind the Markets on SiriusXM 132. Jeremy is a member of the CFA Society of Philadelphia.