The Relationship Between Volatility, Correlation & Portfolio Protection


As academic research has evolved from the single-factor approach of the capital asset pricing model (CAPM) in the 1960s to more sophisticated, multiple-factor models today, market participants who can separate noise from predictive signals have been able to generate excess returns versus the market. Over the last couple of years, I have written about asset correlations and predictive signals for spikes in volatility. In this article, I will take a step further, combining both into a single analysis that seeks to demonstrate a link between correlations and both dispersions and forward volatility. Most importantly, I’ll also identify specific strategies that could provide protection during periods of rising uncertainty.
Correlation Curves
In a recent post, I introduced the idea of correlation curves. To summarize, this approach plots a term structure of average correlations in the equity market in the same way traders think about the term structure of interest rates. That is, each point of the curve is the average of pairwise correlations between all stocks in an equity market across time on the x-axis.
In markets lacking systematic risk, the only difference between the calculation of near-term correlations (i.e., one or two months) and longer tenors (i.e., 24 or 36 months) is simply the addition of more historical data. Thus, average correlation numbers for different windows should not be statistically different. By examining this data, it’s now possible to track changes in the shape of the curve and assess how systematic risk in the market is evolving.
The table below illustrates the three most recent economic crises and how the correlation term-structure went into what the futures world refers to as “backwardation,” i.e., near-term correlation values are higher than far-term correlation values. Over longer periods, such as 36 months, correlations tend to converge toward the non-crisis average of 0.35, as represented by the last row of the table. In short, increasing correlation is a harbinger of increasing volatility.
Average Trailing Correlations for S&P 500 Index Stocks During Economic Crises

Wagging Tail of Correlations: Going Up or Down?
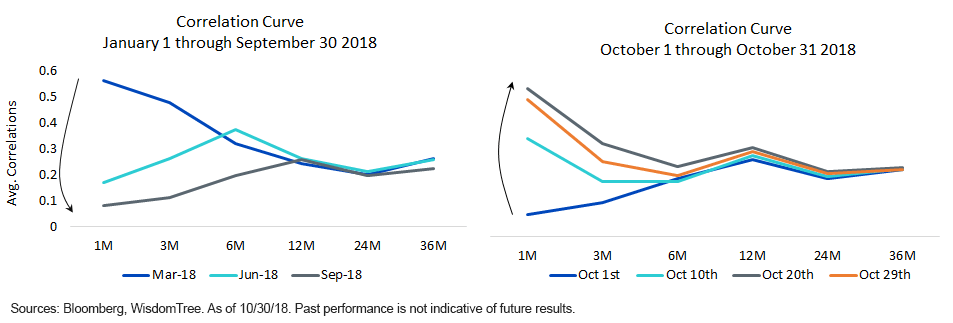
In the chart below left, I plot the correlation curve as of Q1, Q2 and Q3 2018. After the massive spike in volatility on Feb 5, the curve gradually started to flatten (i.e., near-term correlations were declining faster than medium and longer-term correlations). As the tail of the correlation curve went down over the following six months, the S&P 500 rallied by more than 11%.
In the chart to the right, I conduct a similar analysis, plotting the correlation curve every 10 days in October 2018. As correlations rose over the period, markets tanked by almost 7%.

For definitions of terms in the chart, please visit our glossary.
In my view, the wagging of the correlation tail is a signal for market behavior. If the tail goes down, the market goes up (and vice versa).
Accelerating Correlations: A Canary in a Coal Mine?
Taking this analysis a step further, it appears that average correlations could have a predictive power to forecast forward volatility.
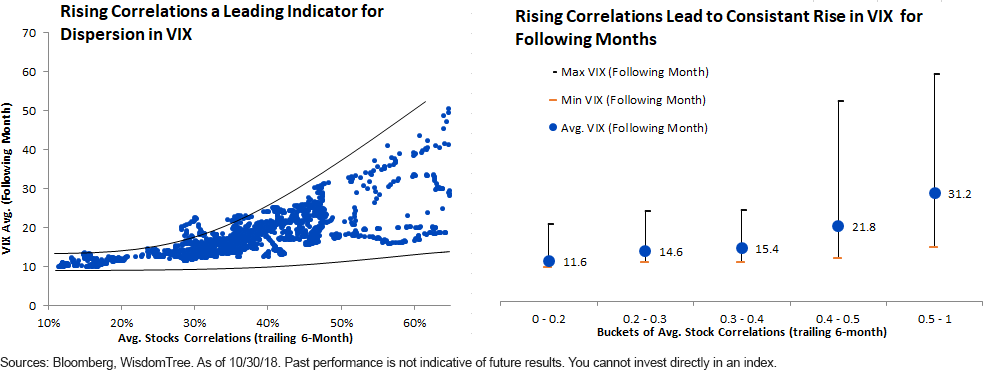
In the chart below left, I show average six-month trailing pairwise stock correlations across all equities in the S&P 500 Index plotted against average VIX levels in the following month on the y-axis. In the chart on the right, I plot the ranges of the VIX for a given correlation bucket.

Our takeaways:
1. Generally, higher correlations across equities led to higher VIX levels the following month. Thus, rising correlations acted as a signal of higher VIX in the future.
2. Higher correlations in equities also tend to lead to a big dispersion in VIX ranges over the following month.
To summarize, accelerating correlations not only act as a precursor for spikes in the VIX, but also indicate potentially unstable swings in values of the VIX.
How Should Investors Allocate in this Environment?
To answer this key question, let’s look at few high-level trends:
1. After nearly a decade of supportive monetary policy that kept volatility constrained, we are entering a period in which interest rates are rising.
2. As markets adjust to a reduction in global central bank balance sheets, systematic risk has the potential to drive correlations higher, which in turn could increase volatility.
3. Given current trade tensions between the U.S. and China, market volatility appears to be increasing as investors grapple with uncertainty.
In our view, none of these challenges are insurmountable for equity markets if earnings continue to grow. However, an alternative method of stock selection and volatility mitigation may become necessary. As pioneers of Modern Alpha™ strategies, WisdomTree has a host of strategies that can help investors navigate the current environment:
1. WisdomTree U.S. Multifactor Fund (USMF): This strategy aims to provide multifactor exposure to U.S. equities through a combination of fundamental (value and quality) and technical (momentum and correlations) factors. USMF aims to deliver quality stock selection that can withstand periods of heightened systematic risk.
2. WisdomTree CBOE S&P 500 PutWrite Strategy Fund (PUTW)/Russell 2000 PutWrite Strategy Fund (RPUT): Both strategies aim to provide a positive correlation to equities, but with significantly lower volatility. These strategies sell one-month at-the-money put options, thereby generating income which could partially offset losses during market corrections. Should markets rise, the put options eventually expire, worthless, allowing investors to generate positive returns. PUTW and RPUT generate income by selling volatility and thus can help lower drawdowns during market corrections.
3. WisdomTree Dynamic Long/Short U.S. Equity Fund (DYLS) and WisdomTree Dynamic Bearish U.S. Equity Fund (DYB): These are long/short equity strategies, which seek to add value through security selection, as well as opportunistically hedging market risk, when fundamentals are mixed and volatility is increasing. DYB has the potential to go net short the market to profit from declines in equity prices.
Conclusion
Trends in correlation can be a powerful predictor of future volatility and risk in equity markets. As investors continue to grapple with short-term uncertainty, we believe our correlation signal can provide valuable insights into broader market trends. At present, we believe a more defensive positioning could be warranted as the current bull market enters its latter stages.
Important Risks Related to this Article
There are risks associated with investing, including possible loss of principal. These Funds will invest in derivatives, including Russell 2000 Index put options (“RUT Puts”) and S&P 500 Index put options (“SPX Puts”). Derivative investments can be volatile, and these investments may be less liquid than securities and more sensitive to the effects of varied economic conditions. The value of the RUT Puts and the SPX Puts in which these Funds invest is partly based on the volatility used by market participants to price such options (i.e., implied volatility). The options values are partly based on the volatility used by dealers to price such options, so increases in the implied volatility of such options will cause the value of such options to increase, which will result in a corresponding increase in the liabilities of the Funds and a decrease in the Funds’ NAV. Options may be subject to volatile swings in price, influenced by changes in the value of the underlying instrument. The potential return to each Fund is limited to the amount of option premiums it receives; however, the Fund can potentially lose up to the entire strike price of each option it sells. Due to the investment strategy of these Funds, they may make higher capital gain distributions than other ETFs. Some of these Funds may engage in “short sale” transactions and will lose value if the security or instrument that is the subject of a short sale increases in value. A Fund that has exposure to one or more sectors may increase these Funds’ vulnerability to any single economic or regulatory development. This may result in greater share price volatility. The composition of the Index is heavily dependent on quantitative models and data from one or more third parties and the Index may not perform as intended. Some of these Funds invest in the securities included in, or representative of, its Index regardless of their investment merit and the Fund does not attempt to outperform its Index or take defensive positions in declining markets. Please read each Funds’ prospectus for specific details regarding the Fund’s risk profile.
The CBOE Russell 2000 PutWrite Index (the “Index”) is a trademark of Frank Russell Company (“Russell”) and has been licensed for use by WisdomTree Asset Management. The CBOE Russell 2000 PutWrite Strategy Fund is not in any way sponsored, endorsed, sold or promoted by Russell or the London Stock Exchange Group companies (“LSEG”) (together, the “Licensor Parties”) and none of the Licensor Parties make any claim, prediction, warranty or representation whatsoever, expressly or impliedly, either as to (i) the results to be obtained from the use of the Index (upon which the CBOE Russell 2000 PutWrite Strategy Fund is based), (ii) the figure at which the Index is said to stand at any particular time on any particular day or otherwise, or (iii) the suitability of the Index for the purpose to which it is being put in connection with the CBOE Russell 2000 PutWrite Strategy Fund. None of the Licensor Parties have provided or will provide any financial or investment advice or recommendation in relation to the Index to WisdomTree or to its clients. The Index is calculated by Russell or its agent. None of the Licensor Parties shall be (a) liable (whether in negligence or otherwise) to any person for any error in the Index or (b) under any obligation to advise any person of any error therein.


