
How to Position for Cyclical Recovery in Europe


A big storyline heading into 2018 is whether this year’s strong performance in European equities will continue in the year to come or if it was merely a flash in the pan for an otherwise dysfunctional economy.
While there are potential headwinds for the recovery (namely, ever-present political risks and the challenge of negative interest rates for a banking system still confronting issues around deleveraging balance sheets while managing portfolios of nonperforming loans), there is also an argument that these risks are sufficiently priced in and this European rally is just getting underway.
For over 11 years, WisdomTree pioneered a proprietary, self-indexing approach to tap into markets in unique ways using a consistent, rules-based manner. A review of the WisdomTree Europe Domestic Economy Index’s construction provides interesting insights for how it benefited from the strong economic growth environment in 2017 and how it is positioned currently should this rally continue into 2018.
On Cyclical Growth
The WisdomTree Europe Domestic Economy Index is designed to represent a pure play on the more local dynamics of the eurozone economy. Many investors often are forced into small-cap companies to avoid large-cap mega-nationals that often are driven by global sentiment, China and the emerging markets. The WisdomTree Europe Domestic Economy Index was designed to be all cap, but it targets sector exposures that benefit from more cyclical changes in growth.
With European growth turning more positive in 2017, the Index’s 31.7% year-to-date returns have outpaced the MSCI EMU Index by over 400 basis points (bps).1 How was this outperformance achieved?
The Index’s methodology has four ways to target eurozone companies most sensitive to the local economy’s growth:
- Sectors: Exclude defensive sectors2
- Size: Use a market cap minimum of $1 billion
- Geographic Revenues: Derive more than 50% of revenue from within Europe
- Weighting: Employ a modified market cap weighting to increase weight to companies that have the highest correlation to the European Commission Economic Sentiment Indicator
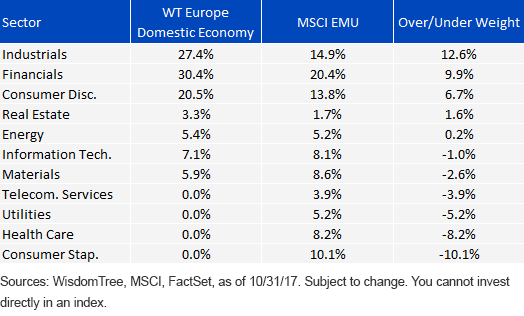
From a sector perspective, these screens and this weighting methodology result in an Index that has no weight in Telecoms, Utilities, Health Care or Consumer Staples, with notable over-weights in the more cyclically oriented Industrials, Financials, and Consumer Discretionary sectors.
The Index rebalances on an annual basis to include only those companies with sufficient domestic revenues and reweights companies to increase the sensitivity of stocks to the local economic prospects using an indicator we see as a forward-looking view of economic momentum. The European recovery at present has benefited from the tailwinds of global growth, but should the mature recovery in the U.S. lose steam or the emerging market growth engine pause, a domestically focused Index should be less impacted by such external factors.
Room to Run: Financials
No market is without its risks, and one risk that is often highlighted for the eurozone is the Financials sector. Financials constitute a 30% weight in the WisdomTree Index, which is a 10% over-weight to the MSCI EMU Index. It is no secret that the European Financials sector has had a more difficult time recovering from the depths of the financial crisis than other sectors, and their recovery has paled in comparison to U.S Financials.
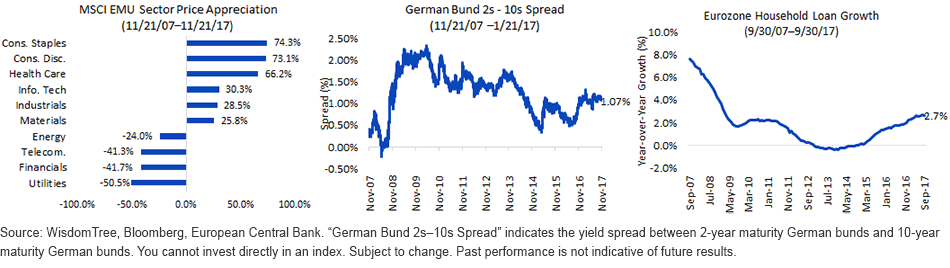
Historical Performance and Valuations: Over the past decade, in terms of price appreciation, the MSCI EMU Financials sector has outperformed only Utilities and has far from recovered to pre-crisis levels as it has returned -42%. Simply a reversion to prior levels would spell great returns ahead. From a valuation perspective, this underperformance has helped result in the sector’s dividend yield of 3.60% and a price-to-earnings multiple of 15.4x, both meaningful discounts from the 2.79% and 18.5x for the broad index.3 At a time when investors are keen on mitigating valuation risks in their global portfolios, this discount could be of interest.
Yield Curve and Loan Growth: The topic of yield curve flattening4 has become ubiquitous with U.S. investors over the past several weeks. In the above graph of the German bund 2s–10s spread, we can see that the spread shows little sign of narrowing, and at 107 bps, flattening is of much less concern than for the U.S., where the spread has narrowed to less than 60 bps.
While the steepness of the yield curve is an important indicator of the economy’s health, it is of utmost importance to analysts of bank profitability. A major source of bank profits is borrowing cheaply at the front end of the yield curve, and then lending those funds at the long end of the yield curve at a higher rate. As loan growth continues to pick up steam, as it has this year, and if there is any upward pressure on longer-dated bund yields as the European Central Bank’s tapering of asset purchases begins next year, banks will be likely to profit.
Conclusion
The WisdomTree Europe Domestic Economy Index was constructed with exactly the type of strong-growth economic environment of 2017 in mind. And there is a case to be made for similar conditions in 2018: monetary policy should keep financial conditions accommodative, inflation appears under control and there is plenty of evidence that the eurozone still has a ways to go in its recovery, not least of which for the Financials sector. For investors that conclude their year-end review with a bullish outlook on European equities, the WisdomTree Europe Domestic Economy Fund (EDOM), which tracks the WisdomTree Europe Domestic Economy Index, may prove an opportune means of accessing the market’s growth.
1Source: Bloomberg, for the period 12/30/16–11/23/17.
2Consumer Staples, Health Care, Telecommunications and Utilities sectors.
3Source: WisdomTree, FactSet, as of 10/31/17.
4Yield Curve Flattening: The spread between long-term interest rates and short-term interest rates narrowing. A flat yield curve is typically associated with a subdued economic outlook from investors.
5Bloomberg, as of 11/21/17.
Important Risks Related to this Article
The Global Industry Classification Standard (“GICS”) was developed by and is the exclusive property and a service mark of MSCI Inc. (“MSCI”) and Standard & Poor’s (“S&P”), a division of The McGraw-Hill Companies, Inc., and is licensed for use by WisdomTree Investments, Inc. Neither MSCI, S&P nor any other party involved in making or compiling the GICS or any GICS classifications makes any express or implied warranties or representations with respect to such standard or classification (or the results to be obtained by the use thereof), and all such parties hereby expressly disclaim all warranties of originality, accuracy, completeness, merchantability and fitness for a particular purpose with respect to any such standard or classification. Without limiting any of the foregoing, in no event shall MSCI, S&P, any of their affiliates or any third party involved in making or compiling the GICS or any GICS classifications have any liability for any direct, indirect, special, punitive, consequential or any other damages (including lost profits) even if notified of the possibility of such damages.
There are risks associated with investing, including possible loss of principal. Foreign investing involves special risks, such as risk of loss from currency fluctuation or political or economic uncertainty. This Fund focuses its investments in Europe, thereby increasing the impact of events and developments associated with the region, which can adversely affect performance. A Fund that has exposure to one or more sectors may increase the Fund’s vulnerability to any single economic or regulatory development. The Fund invests in the securities included in, or representative of, its Index regardless of their investment merit and the Fund does not attempt to outperform its Index or take defensive positions in declining markets. Please read the Fund’s prospectus for specific details regarding the Fund’s risk profile.
Neither MSCI nor any other party involved in or related to compiling, computing or creating the MSCI data makes any express or implied warranties or representations with respect to such data (or the results to be obtained by the use thereof), and all such parties hereby expressly disclaim all warranties of originality, accuracy, completeness, merchantability or fitness for a particular purpose with respect to any such data. Without limiting any of the foregoing, in no event shall MSCI, any of its affiliates or any third party involved in or related to compiling, computing or creating the data have any liability for any direct, indirect, special, punitive, consequential or any other damages (including lost profits), even if notified of the possibility of such.
Index performance does not represent actual fund or portfolio performance. A fund or portfolio may differ significantly from the securities included in the index. Index performance assumes reinvestment of dividends but does not reflect any management fees, transaction costs or other expenses that would be incurred by a portfolio or fund, or brokerage commissions on transactions in fund shares. Such fees, expenses and commissions could reduce returns.
Double-digit returns were achieved primarily during favorable market conditions. Investors should not expect that such favorable returns can be consistently achieved. A fund’s performance, especially for very short time periods, should not be the sole factor in making your investment decision.
Share & Comment
Popular Posts
Categories
Related Links