
Not So Fast, My Friend


The recent sell-off in the U.S. high-yield (HY) market certainly garnered a good deal of attention. Indeed, with HY spreads in general narrowing to levels not seen since 2014, and before that the 2003–2007 period, investors began to entertain the idea that the widening in spreads that occurred from late October through mid-November could be a turning point in the credit markets. To quote ESPN’s College GameDay host Lee Corso: “Not so fast, my friend”.
Let’s rewind the tape to take a look at exactly what happened in the HY market during the aforementioned time frame. From the recent low point of 326 basis points (bps) on October 24, HY spreads subsequently rose by 53 bps to 379 bps, completely reversing the rally investors had witnessed post-Labor Day.
Change in U.S. High-Yield Spread by Sector 11/15/17 vs. 10/24/217
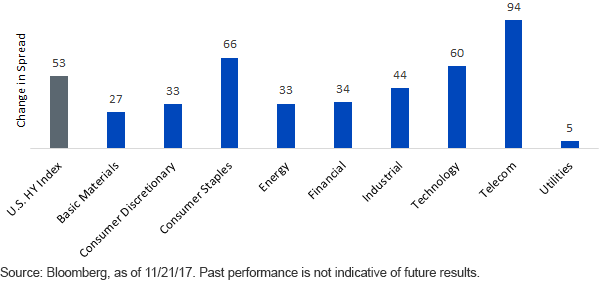
Oftentimes, spread widening in the HY arena is precipitated by a sell-off in the Energy sector, which tends to act as a drag on the asset class as a whole. While the Energy sector did take part in this most recent episode, this table underscores the point that this was more than just a “single-sector” phenomenon, as essentially all of the underlying categories experienced wider spread readings. The three worst-performing sectors were Telecom, Consumer Staples and Technology. It should be noted, however, that HY sectors can be somewhat concentrated, so a bad performance by a single issuer or two could skew the result of the overall sector, accordingly.
As opposed to taking broad market exposure to corporate HY, investing in a smart beta strategy can provide access to bonds with more attractive credit fundamentals. Deteriorating profitability or increasing debt levels, for example, are factors that may trigger a sell-off in a company’s debt.
Here at WisdomTree, leverage and profitability are two of the factors considered to screen for quality and tilt toward income. Our view is that companies with positive free cash flow are well positioned to meet their interest expenses, have greater flexibility to manage their balance sheet and ultimately have a higher probability of paying back the principal on a bond. To generate healthy income, our smart beta credit strategies weigh bonds by a spread over Treasuries, which has been adjusted for probability of default. Such an approach provides a bias away from companies with higher leverage while enhancing a strategy’s income potential. A highly leveraged company may have difficulty managing both liabilities as well as operating expenses, and this should be factored in when investing in HY bonds.
In fact, several of the Telecom and Consumer Staples bonds that sold off in November had negative free cash flow. Roughly 25% of the sell-off in the first half of November came from bonds with negative free cash flow (on average over the past three years). Within the Telecom sector, many companies take on higher levels of leverage and do so with large capex expenditures. Higher-leveraged companies have borrowings that are materially higher than their earnings. When generating income in a HY strategy, we believe it is important to consider both the coupon as well as the probability that a company can make these interest payments.
Conclusion
Since reaching the recent mid-November peak, the HY market has since bounced back, with spreads recovering by 25 bps, or a 47% retracement. Admittedly, it seems difficult for the HY sector to continue to post the positive returns that have been evident over the last two years. In fact, future bouts of spread widening should not be ruled out. However, outside of periods of economic/financial stress, history tells us that this is where spread levels can potentially reside. Often, investors look at turns in the credit cycle, especially HY, as a potential harbinger for selling in the equity markets. We do not see this latest bout of HY selling as indicative of a turn in the credit cycle, and as a result, there is no corresponding signal for the equity market.
Unless otherwise noted, data source is Bloomberg, as of November 21, 2017.
Share & Comment
Popular Posts
Categories
Related Links