Why Does WisdomTree Select and Weight by Income?


Over a decade ago, we challenged conventional investment philosophy by launching passive Indexes that selected and weighted companies by income rather than market capitalization. The approach held out the potential to generate passive alpha while maintaining broad exposure to major U.S. asset classes. WisdomTree largely succeeded in its mission, as shown by the 10-year performance of both its dividend-weighted Index suite and its earnings-weighted Index suite.
With so many factors available to be used, we are often asked how we had the foresight to use dividends or earnings as the cornerstone of our investment methodology. While there are many reasons, such as the intuitiveness of using income to measure a company’s financial health, there is also an academic rationale for why earnings and dividends work so well.
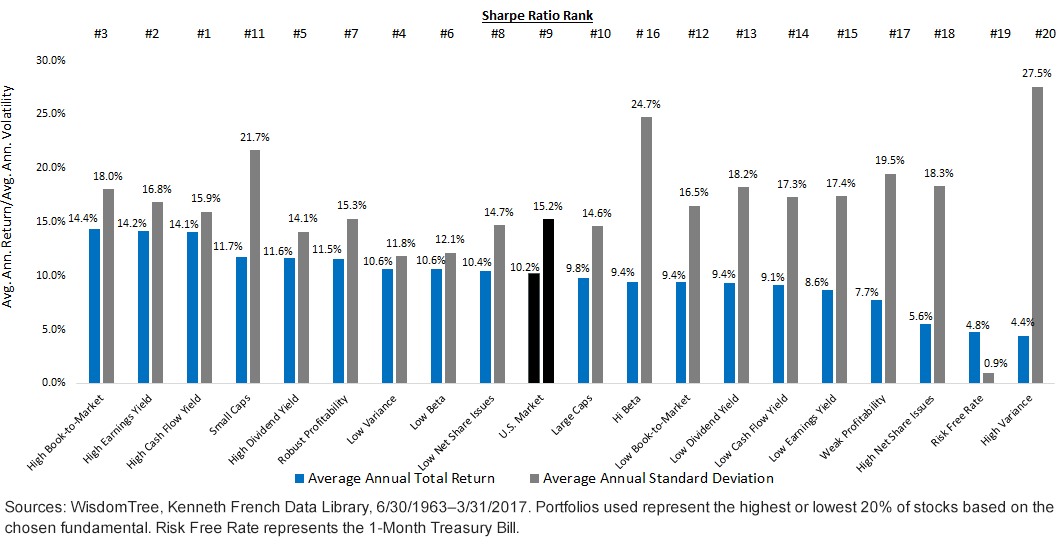
The chart below shows various Eugene Fama and Kenneth French portfolios going back over 50 years. For example, the High Book-to-Market Portfolio represents a basket of stocks, chosen from a universe consisting of the NYSE, AMEX and NASDAQ, in which the top 20% (or top quintile) of companies ranked by high book-to-market are selected, rebalanced annually and weighted by their market value. If one just looked at the portfolios to the left of the U.S. market (in black) and then looked at the portfolios to the right, the efficacy of selecting companies by attractive fundamentals becomes apparent. The more attractive quintile of each fundamental beat the market over the last half century, while the less attractive quintile underperformed the market.
Fama and French Portfolios, 1963–2017

The High Earnings Yield Portfolio, also known as a low Price-to-Earnings Portfolio, outperformed the broad U.S. Market by 4% per year since 1963. The High Dividend Yield Portfolio, while outperforming the market by a smaller (but still impressive) 1.4%, did so with over 1% less annualized volatility than the market.
Breaking Down Factor Exposures Over Time
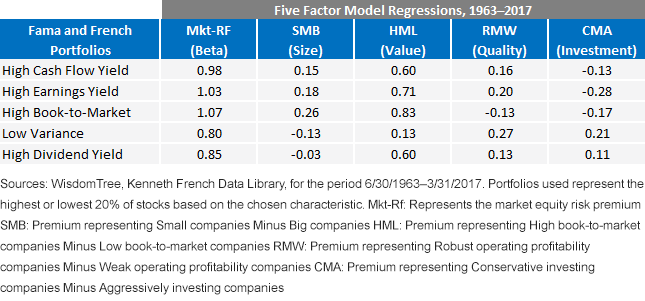
Ultimately, one of the best ways to gauge risk-adjusted returns is the Sharpe Ratio. For this reason, we chose the top five portfolios by their Sharpe Ratio over this period, and we ran regressions against the Fama and French five-factor model to help answer the question: “How did they do it?”

The High Book-to-Market Portfolio posted the highest returns but also the highest volatility of these five portfolios (measured by both its beta in the table and its standard deviation in the first chart). This can be partially explained by its .26 loading to the size factor, or smaller capitalization companies over time. It also loads highest to the value factor, which should be expected, because the value premium used in the regression is also formed by measures of book-to-market. Interestingly, we noticed that the High Book-To-Market Portfolio, while potent, lacked a positive loading to the quality factor. The four remaining portfolios, however, all shared a common theme: positive loadings to both value and quality.
Given this likeness, there are also some interesting reciprocities among the remaining four portfolios:
- The High Earnings Yield Portfolio and Low Variance (Low Volatility) Portfolio both had high positive loadings to the quality factor, but the High Earnings Yield Portfolio loaded meaningfully higher to value, and the Low Variance Portfolio loaded lower to beta.
- The High Dividend Yield Portfolio managed to have a value loading approaching the High Earnings Yield Portfolio, maintained a low beta exposure like that of the Low Variance Portfolio, and still loaded positively to the quality factor, though to a lesser extent.
Conclusion
One reason this post did not focus specifically on our Indexes and how they are built is because their methodologies can be described in one sentence: we select virtually all companies by either dividends or earnings, and weight them by their share of aggregate dividends or earnings. This provides broad diversified exposure that moves very much in line with the market but does it while tapping into proven sources of excess return and providing the potential for better risk-adjusted returns.
Using Fama and French portfolios, we observed how earnings tapped into value and quality, and how dividends, with similar but different exposures, also tapped into value and quality, while also reducing volatility, as measured by a lower beta. WisdomTree also takes it another step further, limiting the market-cap size of certain Index offerings, thus introducing the size factor into the equation. All of WisdomTree’s core dividend-weighted and earnings-weighted Indexes have been tracked by an investable exchange-traded fund for more than a decade, generating a historical track record of what multifactor exposure looks like in real-time over a full decade.
We are aware that dividends and earnings do not capture every factor, such as momentum, but we continue to believe they can act as the bedrock of a strategic multifactor approach in the core of one’s portfolio.
1We’d like to note that High Earnings Yield and High Cash Flow Yield are very similar both on a return and volatility basis, and based on their factor loadings over time. They are also philosophically similar in the fundamental used to select stocks. For the purposes of this post, we will be focusing on the High Earnings Yield Portfolio.
Important Risks Related to this Article
Dividends are not guaranteed, and a company currently paying dividends may cease paying dividends at any time.
