WisdomTree’s 10 Year Anniversary: How Did We Do?


A decade ago, WisdomTree launched its first 20 exchange-traded funds (ETFs) on the New York Stock Exchange (NYSE). The launch was historic because it represented, at that time, the largest listing by a single issuer in the 200-year history of the NYSE. WisdomTree’s debut on June 16, 2006, included the industry’s first international small-cap ETF, the first European small-cap ETF and the first Japanese small-cap ETF. But the listing was also historic because it gave investors, for the first time, a way to invest in dividend-weighted ETFs in most major equity markets around the world—a fundamental alternative to traditional market capitalization weighted investing.
The 2006 launch was based on WisdomTree’s original vision that weighting equity markets by income, rather than by market capitalization, would represent a significant evolution in indexing. After testing the performance of dividend-paying securities spanning several decades, WisdomTree concluded that by using only dividend-paying stocks and weighting them once a year based on the dollar value of dividends companies pay—rather than their market value—that it was possible to generate higher returns, often with lower volatility, than traditional cap-weighted approaches.
Passive investing has undoubtedly served investors well over the past 30 years. Numerous studies confirm that, over time, the vast majority of actively managed mutual funds have failed to outperform comparable cap-weighted indexes, after accounting for fees, expenses and transaction costs.1 The question we posed more than a decade ago, and which many investors are asking today, is this: Despite great strengths compared to active managers, are cap-weighted indexes optimal from an investment perspective? Or can alternatively weighted indexes serve passive investors better than index funds based on traditional benchmarks?
WisdomTree U.S. Dividend-Weighted Index Returns, 2006–2016
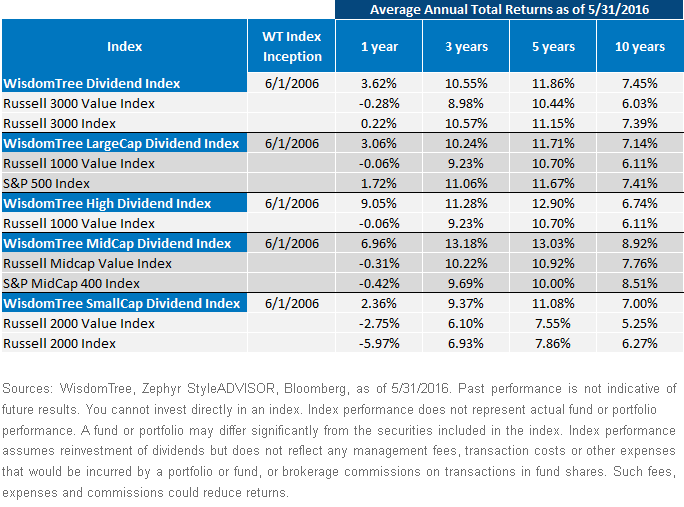
So what was observed in real time since the WisdomTree Indexes began to be calculated and disseminated on May 31, 2006? Eleven of WisdomTree’s 12 dividend-weighted Indexes beat their comparable broad based cap-weighted index over the past 10 years in the U.S. and in the developed world. When measured against the value segments of the benchmarks, the comparisons tilt even more overwhelmingly in favor of WisdomTree’s dividend-weighted Indexes. All 12 of the WisdomTree dividend-weighted Indexes beat their value benchmarks. This is important, as a dividend-weighted approach is most often classified in the value style when peer group comparisons and when regression analysis is conducted to examine what factor exposures are represented in the returns. In this blog post, we will examine the returns of the U.S.-based indexes. The figure below displays results for WisdomTree’s U.S. dividend-weighted Indexes over the most recent one-year, three-year, five-year and ten-year periods against traditional indexes.
Average Annual Returns, WisdomTree U.S. Dividend-Weighted Indexes, (5/31/2006–5/31/2016)
A couple of important takeaways:
• All fiveWisdomTree Indexes outperformed their comparable cap-weighted value indexes over the last 10 years. In fact, all five WisdomTree Indexes generated higher annualized returns over the last one-year, three-year, five-year and ten-year time frames than did the value benchmarks in those categories.
• WisdomTree generated greater excess returns in the mid- and small-cap segments, traditionally viewed as the less efficient part of the U.S. stock market. Both the WisdomTree MidCap Dividend Index and the WisdomTree SmallCap Dividend Index outperformed the core and the value cuts of their cap-weighted peers over each of the periods displayed in the table.
• Not only did the WisdomTree MidCap Dividend Index beat the S&P 400 MidCap Index, it beat the S&P 500 Index by 151 bps per year over the past decade.
Conclusion
WisdomTree’s Indexes were constructed to introduce a measure of valuation into index weights, so investors would not buy equity markets based solely on the prices paid by previous investors. Rather than weighting each component based on its market value, WisdomTree’s broad-based dividend Indexes typically include all investable stocks that pay dividends and then weight them annually based on a measure of relative value: the cash dividends each company pays as a percentage of the total amount of cash dividends paid by all the companies in that market. We call this weighting by the Dividend Stream®. Real-time results, going back 10 years, suggest this may be a better way to own equity markets, both in the U.S. and in the developed world, compared to comparable indexes that set weights based on a company’s market value.
1One example of such an analysis is the S&P SPIVA study.
Important Risks Related to this Article
Dividends are not guaranteed, and a company’s future ability to pay dividends may be limited. A company currently paying dividends may cease paying dividends at any time.


