Taking Some Chips Off the Small Cap Table


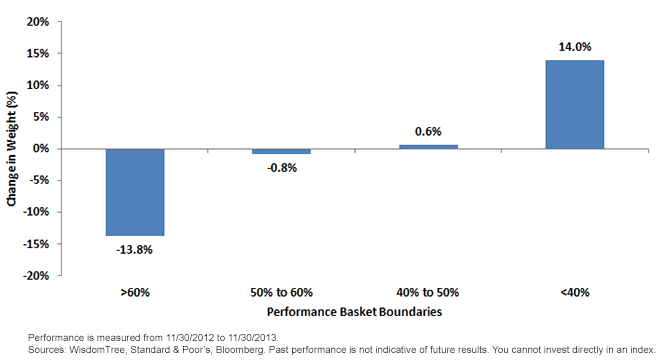
 • Over 40% of Weight Returned Over 60%: It was a great year in U.S. small caps, and WTSEI’s constituents were no exception. The overall Index returned nearly 50% between annual screening dates. Prior to the November 30, 2013, screening, more than 40% of its weight was in constituents that had returned better than 60%.
• Subtracting from Winners and Adding to Losers: Regardless of how strong a year it must be to have “losers” defined as those returning less than 40%, we clearly see that weight is taken from those firms with returns greater than 60% over the prior year and redistributed to firms with returns below 40%.
• Accounting for the “Drop-Down” Effect: Some might correctly point out the possibility for underperforming firms in the WisdomTree MidCap Earnings Index (WTMEI) to decrease in their market capitalizations such that they can become constituents of WTSEI. Approximately 11% of the weight of the new constituents of WTSEI were part of WTMEI prior to the November 30, 2013, rebalance. While WTMEI returned over 40% in aggregate, the average performance for these particular firms was below 5%, meaning that they were in fact some of WTMEI’s lower performers.
Effectively Taking the “Decision” Off the Table
WTSEI’s relative value rebalance, the mechanics of which are seen above, is helpful in that it attacks the market in a disciplined way each and every year. This is especially important after the phenomenal performance of U.S. small caps this year, in that we believe investors might tend to want to hold on to the stronger performers. In sticking to the investment mantra “buy low, sell high,” a relative value rebalance may aid in accomplishing this notably difficult action—a key feature of how we think investors can become smarter with their beta exposures.
1Refers to the Russell 3000 Index, S&P 500 Index, S&P MidCap 400 Index and Russell 2000 Index.
2Refers to the 12/31/2012 to 11/30/2013 period.
3Source: Bloomberg.
4Refers to the 11/30/2012 to 11/30/2013 period, specifically from the 2012 rebalance screen to the 2013 rebalance screen.
5Each of the following return figures is sourced from Bloomberg for the 11/30/2012 to 11/30/2013 period.
• Over 40% of Weight Returned Over 60%: It was a great year in U.S. small caps, and WTSEI’s constituents were no exception. The overall Index returned nearly 50% between annual screening dates. Prior to the November 30, 2013, screening, more than 40% of its weight was in constituents that had returned better than 60%.
• Subtracting from Winners and Adding to Losers: Regardless of how strong a year it must be to have “losers” defined as those returning less than 40%, we clearly see that weight is taken from those firms with returns greater than 60% over the prior year and redistributed to firms with returns below 40%.
• Accounting for the “Drop-Down” Effect: Some might correctly point out the possibility for underperforming firms in the WisdomTree MidCap Earnings Index (WTMEI) to decrease in their market capitalizations such that they can become constituents of WTSEI. Approximately 11% of the weight of the new constituents of WTSEI were part of WTMEI prior to the November 30, 2013, rebalance. While WTMEI returned over 40% in aggregate, the average performance for these particular firms was below 5%, meaning that they were in fact some of WTMEI’s lower performers.
Effectively Taking the “Decision” Off the Table
WTSEI’s relative value rebalance, the mechanics of which are seen above, is helpful in that it attacks the market in a disciplined way each and every year. This is especially important after the phenomenal performance of U.S. small caps this year, in that we believe investors might tend to want to hold on to the stronger performers. In sticking to the investment mantra “buy low, sell high,” a relative value rebalance may aid in accomplishing this notably difficult action—a key feature of how we think investors can become smarter with their beta exposures.
1Refers to the Russell 3000 Index, S&P 500 Index, S&P MidCap 400 Index and Russell 2000 Index.
2Refers to the 12/31/2012 to 11/30/2013 period.
3Source: Bloomberg.
4Refers to the 11/30/2012 to 11/30/2013 period, specifically from the 2012 rebalance screen to the 2013 rebalance screen.
5Each of the following return figures is sourced from Bloomberg for the 11/30/2012 to 11/30/2013 period.Important Risks Related to this Article
Investments focusing on certain sectors and/or smaller companies increase their vulnerability to any single economic or regulatory development. This may result in greater share price volatility.

Christopher Gannatti began at WisdomTree as a Research Analyst in December 2010, working directly with Jeremy Schwartz, CFA®, Director of Research. In January of 2014, he was promoted to Associate Director of Research where he was responsible to lead different groups of analysts and strategists within the broader Research team at WisdomTree. In February of 2018, Christopher was promoted to Head of Research, Europe, where he was based out of WisdomTree’s London office and was responsible for the full WisdomTree research effort within the European market, as well as supporting the UCITs platform globally. In November 2021, Christopher was promoted to Global Head of Research, now responsible for numerous communications on investment strategy globally, particularly in the thematic equity space. Christopher came to WisdomTree from Lord Abbett, where he worked for four and a half years as a Regional Consultant. He received his MBA in Quantitative Finance, Accounting, and Economics from NYU’s Stern School of Business in 2010, and he received his bachelor’s degree from Colgate University in Economics in 2006. Christopher is a holder of the Chartered Financial Analyst Designation.

