Why We Believe Emerging Markets Are Cheap?


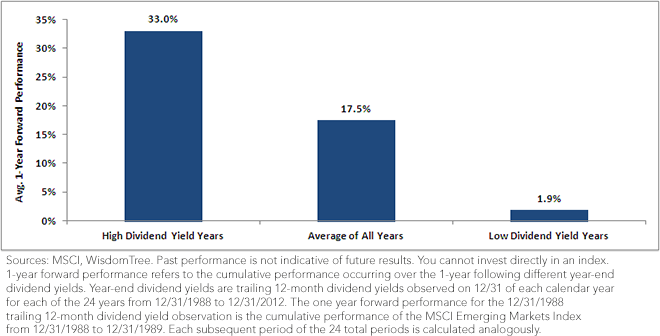
 • Squarely in the High Dividend Yield Year Range: As of July 31, 2013, the MSCI EM exhibited a trailing 12-month dividend yield of 2.93%. There were five calendar years that started with a higher value, and each was associated with a positive subsequent return. While this past performance cannot guarantee any particular future return, we do believe that 2.93% is a strong potential valuation indicator relative to the performance history of the MSCI EM.
• Big Dispersion from High to Low: We’ve certainly pointed to this analysis before, and we’ll bring it up again and again to emphasize its importance. The three bars in this figure make the statement that valuation is of paramount importance for the MSCI EM. On average, returns of the High Dividend Yield Years eclipsed those of the Low Dividend Yield Years by over 30%.
Conclusion
While the dividend yield analysis is a strong and important indicator for the broader market, we also want to look at other factors. We will look at price-to-earnings (P/E) ratios and how they differ across emerging market sectors as well as countries. Additionally, we will close this series with two blog posts aimed at showing that all emerging market equity indexes are not created equal. Each index approach trades off certain attributes to focus on others. A critical question must be asked: If one believes emerging markets are inexpensive and represent a good opportunity, are you best positioned to capture the market’s upside? Many investors may not be, and we will try to provide a framework to understand the trade-offs made in various approaches to indexing.
Read the full research paper here.
• Squarely in the High Dividend Yield Year Range: As of July 31, 2013, the MSCI EM exhibited a trailing 12-month dividend yield of 2.93%. There were five calendar years that started with a higher value, and each was associated with a positive subsequent return. While this past performance cannot guarantee any particular future return, we do believe that 2.93% is a strong potential valuation indicator relative to the performance history of the MSCI EM.
• Big Dispersion from High to Low: We’ve certainly pointed to this analysis before, and we’ll bring it up again and again to emphasize its importance. The three bars in this figure make the statement that valuation is of paramount importance for the MSCI EM. On average, returns of the High Dividend Yield Years eclipsed those of the Low Dividend Yield Years by over 30%.
Conclusion
While the dividend yield analysis is a strong and important indicator for the broader market, we also want to look at other factors. We will look at price-to-earnings (P/E) ratios and how they differ across emerging market sectors as well as countries. Additionally, we will close this series with two blog posts aimed at showing that all emerging market equity indexes are not created equal. Each index approach trades off certain attributes to focus on others. A critical question must be asked: If one believes emerging markets are inexpensive and represent a good opportunity, are you best positioned to capture the market’s upside? Many investors may not be, and we will try to provide a framework to understand the trade-offs made in various approaches to indexing.
Read the full research paper here.Important Risks Related to this Article
Dividends are not guaranteed, and a company’s future ability to pay dividends may be limited. A company currently paying dividends may cease paying dividends at any time. Investments in emerging, offshore or frontier markets are generally less liquid and less efficient than investments in developed markets and are subject to additional risks, such as risks of adverse governmental regulation and intervention or political developments.

Jeremy Schwartz has served as our Global Chief Investment Officer since November 2021 and leads WisdomTree’s investment strategy team in the construction of WisdomTree’s equity Indexes, quantitative active strategies and multi-asset Model Portfolios. Jeremy joined WisdomTree in May 2005 as a Senior Analyst, adding Deputy Director of Research to his responsibilities in February 2007. He served as Director of Research from October 2008 to October 2018 and as Global Head of Research from November 2018 to November 2021. Before joining WisdomTree, he was a head research assistant for Professor Jeremy Siegel and, in 2022, became his co-author on the sixth edition of the book Stocks for the Long Run. Jeremy is also co-author of the Financial Analysts Journal paper “What Happened to the Original Stocks in the S&P 500?” He received his B.S. in economics from The Wharton School of the University of Pennsylvania and hosts the Wharton Business Radio program Behind the Markets on SiriusXM 132. Jeremy is a member of the CFA Society of Philadelphia.

