
Value Factor: In-N-Out vs. Shake Shack


What’s better: In-N-Out, the West Coast burger chain with a cult-like following, or Shake Shack, the burger joint founded by famous New York restauranteur Danny Meyer?
Members of WisdomTree’s research team could (hypothetically) go back and forth, arguing the merits of either: taste, cost, atmosphere, beverage offerings—and on and on.
But why have this conversation at all? They are both really good and handily beat the average burger.
There are many ways to judge a burger; there are just as many ways to determine what makes up a good investment factor.
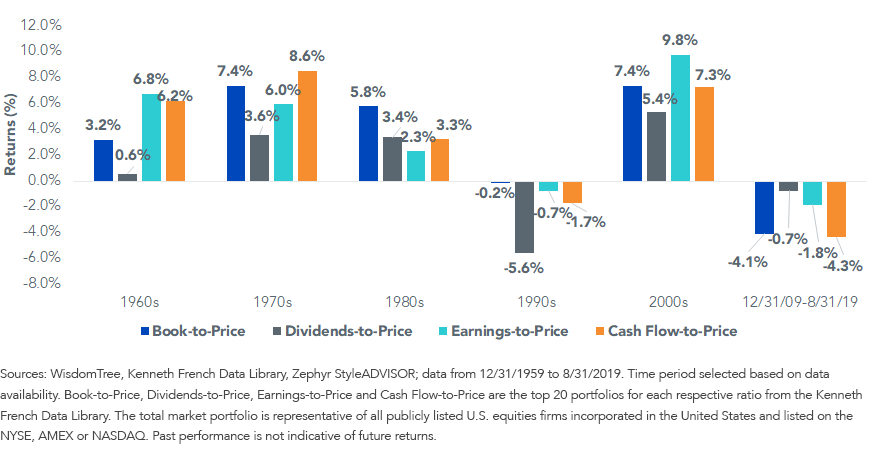
There are dozens of metrics that have historically been used to capture the value premium—all standard measures of value (price relative to book value, dividends, earnings, cash flow, etc.) have been found to outperform the market averages over the long run, with each outperforming over different periods of time.
Best Value Measure Varies by Decade—Dividends Were Strongest in Latest Decade
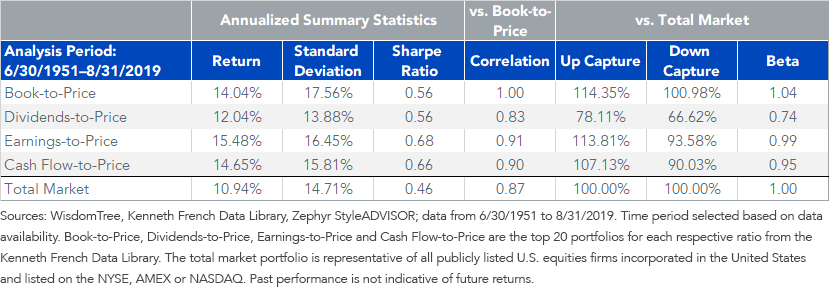
Performance Summaries
The table below shows the performance of the top-quintile portfolios on each respective ratio since 1951. The first thing to note is that each measure of value outperformed the returns of the total market on both an absolute and a risk-adjusted basis.
Investors familiar with the value factor should not be surprised to see that three of the four portfolios had at least 100 basis points (bps) of incremental risk (standard deviation) over the market. This supports the risk-based argument of why the value factor exists and why it should continue to provide excess returns in the future. Value investors are incurring greater volatility by investing in distressed or cyclical businesses; therefore, they should achieve greater returns.
The only measure of value that outperformed with lower risk was the dividends-to-price (dividend yield) portfolio. It had lower standard deviation, down capture of just 67% and a beta of 0.74 to the total market.
How can this outperformance be possible?
In addition to the risk-based arguments for why value “works,” there are some behavior-based arguments. For example, investors get overly excited about growth stocks with seemingly endless potential, many of which pay low or no dividends. Investors typically bid up these companies’ prices, causing subsequent underperformance against underpriced high dividend payers. And these dividend payers tend to be favored during periods of market volatility when the safety of a tangible dividend payment is typically preferred to the unknown of future earnings from growth companies.
Value Portfolios—Correlations, Return and Risk
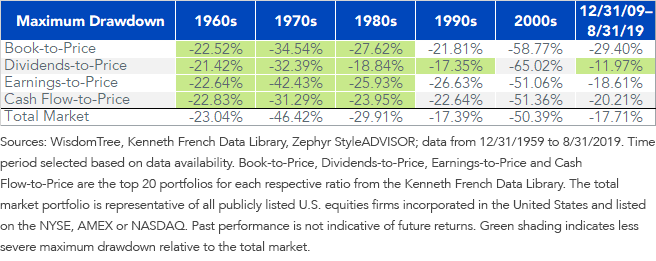
Of all the maximum drawdowns over the past few decades, the dividend yield portfolio has offered the greatest protection in five out of the six periods. From a behavioral finance perspective, this may make it easier to hold the dividend yield portfolio over the long run, allowing investors to capture the tough-to-stomach value premium.
A debate rages on as to why these premiums exist, but each has exhibited a pattern of outperforming the total market portfolio.
Conclusion
A good indicator of a robust factor is its flexibility within slightly different definitions and the economic rationale for its existence.
We have shown the absolute and risk-adjusted outperformance of four different commonly accepted definitions of value and provided the main arguments for why they exist.
Dividend yield was the most defensive measure of value, given its lower risk characteristics. The other measures of value were riskier and more pro-cyclical and had higher absolute returns.
There are a few notable drawbacks to each1:
- Dividend Yield—Had the lowest absolute returns of the four value measures, and cannot value firms that do not pay dividends (approx. 23% weight of Russell 3000 Index).
- Price-to-Earnings—Earnings can be manipulated by management, and this metric fails to account for companies with negative earnings (approx. 4% weight of Russell 3000 Index).
- Price-to-Cash Flow—Had a higher portfolio turnover than other value metrics, and cannot value companies with negative cash flow (approx. 3% weight of Russell 3000 Index).
- Price-to-Book—Book value uses historical costs for asset values, does not account for intangible assets and can be distorted by share buybacks and dividends (approx. 5% weight of Russell 3000 Index in negative book value).
Depending on investor risk tolerance or view on what stage of the business cycle we may be in, the lower volatility and defensive characteristics of a dividends-based approach to value may be attractive, particularly for pairing with a value approach that is more pro-cyclical, such as price-to-book.
So maybe the debate should not be In-N-Out vs. Shake Shack, but rather pairing a ShackBurger with some In-N-Out animal-style fries.
1Sources for the Russell 3000 Index data points: WisdomTree, FactSet; data as of 9/30/19.
Share & Comment
Popular Posts
Categories
Related Links