
What Do Rising Correlations Signal?


Just when everyone expected that volatility would never come back, early last month, we saw a massive spike in Cboe’s Volatility Index, or VIX, known popularly as the “‘market’s fear gauge.” Timing markets is never easy, and a spike in the market’s fear can rarely be predicted with complete accuracy, but does it mean investors should liquidate and divest their portfolios?
Below are highlights of events from February 5 and what generally technical signals imply for investors looking ahead.
A Jump of Historic Magnitude
I have been consistently writing on why investors should not be complacent about low VIX levels and why it is important to look at both historical and realized volatility. On the second trading day of last month, February 2, we noticed a peculiar trend in which realized volatility, after staying low for a long time, accelerated more than implied volatility, thereby compressing spreads. What happened on the next trading day, February 5, was truly remarkable:
- The S&P 500 closed down more than 4%.
- VIX jumped >20 points in a single day.
VIX and the S&P 500 are generally negatively correlated; therefore, it is normal for VIX to jump when the S&P 500 declines. However, a 20-point jump in VIX is something that deserves special attention here.
Until February 5, since the inception of VIX in March 1990, a jump as high as 20 points by VIX in a single day had NEVER happened. To put it in perspective, the S&P 500 over the same period had 32 days with 4% or more declines, but on none of those days did VIX jump as much. Under a normal distribution, this was a 5 standard deviation move with a likelihood of 0.002%. Thus a 4% decline by the S&P is rare, but a 20-point jump by VIX is extreme.
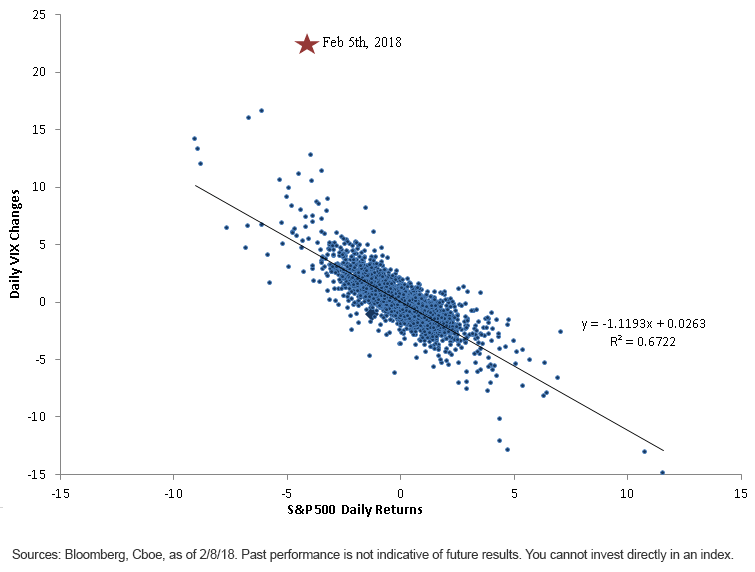
The exhibit below shows the relationship between S&P daily returns and VIX daily changes. Looking at the historical relationship, VIX daily changes have had a beta of -1.12 to S&P daily returns. This simply means that a 4% decline in the S&P 500 should have meant a jump of roughly 4.48 points in VIX. However, VIX jumped about 4.5 times more!
VIX Jumps 4.5 Times Its Historical Beta to S&P 500 Returns
Technicals Pointing to More Defensive Stance
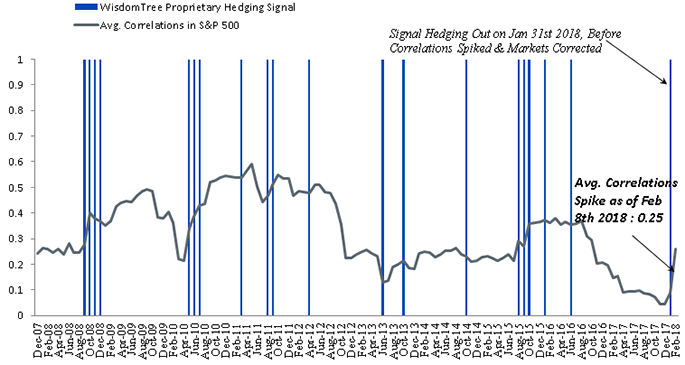
Below is our average correlation chart, which takes pairwise correlation across all stocks in the S&P 500 and then averages to get a sense of diversification being offered by a given market. Increasing correlations are often indicative of frothier or riskier markets. What we have seen more recently is a pickup in average correlations, and some of our research on dynamic risk factors suggests the rising correlations would lean to a more defensive posture.
I have written previously on declining correlations in a post-QE world. Here I overlay our proprietary risk signal with average correlations of the S&P 500, and we notice that, just before the market corrected, our signal detected unstable conditions and turned the hedging indicator “on” as of January 31. Summarizing long-term average returns in the table below, months during which our indicator was on witnessed an average decline in equities by more than 100 basis points (bps).1
Pickup in Average Correlations
12/31/2007–2/8/2018

Conclusion
Rising correlations, in our research, have suggested we could be in for a more challenging market environment than normal. This should lead investors to look for diversifying asset classes—and some of our work on managed futures strategies suggests that may be one area to look for less correlated exposures.
Moreover, our U.S. fundamental equity strategies across dividend and earnings strategies select companies whose valuations can help manage valuation risk. I think by combining our fundamental approach with alternative and risk-mitigating strategies, investors can stay invested, thereby potentially benefitting from the diversification that equities can offer while still protecting downside.
Unless otherwise stated, all data points based on Bloomberg, CBOE data for period of 12/31/1997 to 2/8/2018.
1Sources: Bloomberg, WisdomTree, as of 2/8/18.
Share & Comment
Popular Posts
Categories
Related Links