A New Strategy Seeks to Reduce Drawdowns of Small-Cap Equities


Investing with alternatives and option strategies that focus on volatility reduction may appear complicated, but new indexes have been designed to help simplify an approach with a goal of providing risk-mitigation strategies. I have demonstrated previously how the CBOE S&P 500 PutWrite Index (PUT) can provide downside protection compared to the traditional S&P 500 Index due to the index strategy, which incorporates premium income generated by selling a sequence of one-month, at-the-money, S&P 500 Index puts, whose proceeds are allocated to U.S. Treasury Bills in the index.
WisdomTree recently launched a similar put writing strategy for small caps and the Russell 2000 Index, the WisdomTree CBOE Russell 2000 PutWrite Strategy Fund (RPUT), a passive investment strategy that tracks the Cboe Russell 2000 PutWrite Index (PUTR), before fees and expenses. In this post, I highlight how PUTR historically has reduced drawdowns in a more volatile market space — i.e., domestic small caps.
PutWrite Strategy on Small Caps — i.e., the Russell 2000 Index
RPUT invests in short-duration Treasury Bills and collects premiums by selling Russell 2000 put options. The number of puts sold is chosen to ensure full collateralization. This means the strategy is 100% collateralized. In other words, the strategy employs no leverage.
In a previous introduction to the strategy, my colleague illustrated the lower volatility and down capture of the PUTR compared to the traditional Russell 2000 Index – standard deviations that were 7.95% since its inception, compared to the Russell 2000’s 14.21%1.
But let’s go a step further in evaluating the lower-volatility approach.
Lower Drawdowns in Almost All Calendar Quarters!
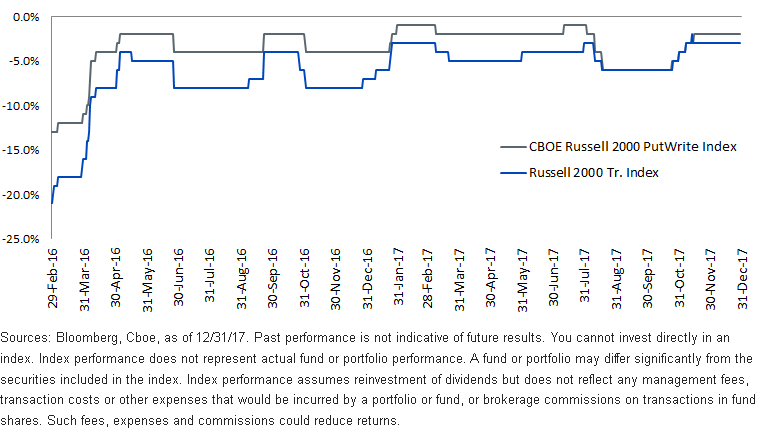
Most investors prefer to look for their portfolio drawdowns over a medium-term basis. In the following example, I compare quarterly rolling drawdowns of PUTR to that of the Russell 2000 Index for the entire live history.
PUTR had a lower drawdown not only in one or two calendar quarters but essentially equal or lower drawdowns in all rolling quarters.
Rolling Quarterly Drawdowns

Granular Analysis of Day-to-Day Returns on Upside and Downside
This quarterly drawdown record led us to investigate returns of PUTR and the Russell 2000 Index with even more granularity—i.e., on a daily basis under two scenarios:
- Days when the Russell 2000 Index experienced drawdowns
- Days when the Russell 2000 Index rallied
Comparing the two scenarios, the outperformance of PUTR’s daily returns shows a staggering constancy on the downside.
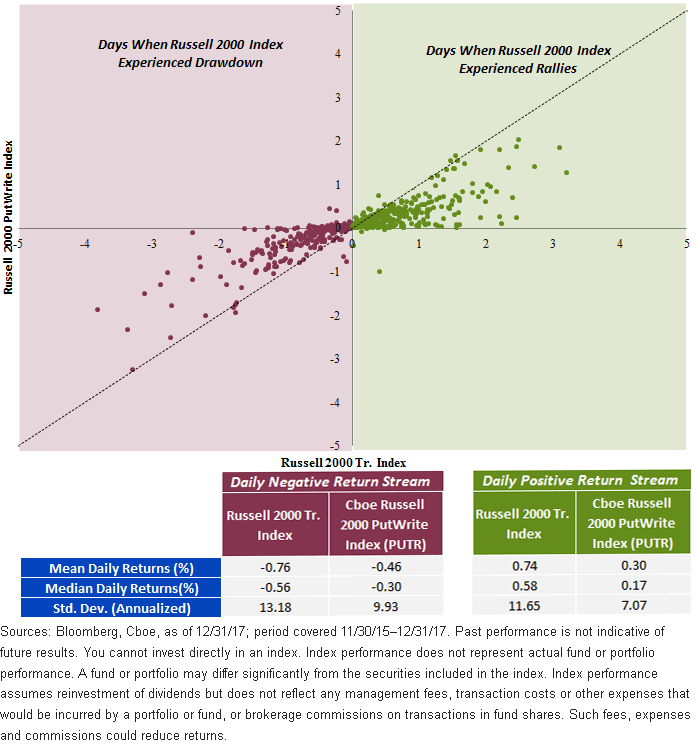
Below is a scatter plot with returns of PUTR on the vertical axis and the Russell 2000 Index on the horizontal axis. If returns of the two indexes were exactly same for all days, all dots would line up on the 45-degree line. When a dot is above this line, PUTR had better returns than the Russell 2000 Index on that day; if a dot is below the 45-degree line, then vice versa.
Daily Returns of the Cboe Russell 2000 PutWrite Index and the Russell Tr. 2000 Index

Looking at the plot above, a few observations immediately stand out:
- Most of the dots in the lower left quadrant are above the 45-degree line. This means that most of the days when the Russell 2000 Index had negative returns, PUTR outperformed.
o Out of 238 days that the Russell 2000 Index had negative returns, there were just 11 days where PUTR lagged. Therefore, PUTR provided a consistent outperformance over 95% of the time on the downside.2
- To be fair, on the opposite side, most of the days that the Russell 2000 Index rallied (top right quadrant), PUTR lagged the Russell 2000 Index.
o Out of 287 days that Russell 2000 Index had positive returns, PUTR lagged in 259 days. Thus on the upside, PUTR lagged Russell 2000 about 90% of the time
- Finally, breaking down the return stream into days with negative returns of the Russell 2000 Index versus days with positive returns (table below the plot), in both instances PUTR had lower volatility in addition to having lower mean/median returns.
Thus, it’s not just an average daily outperformance of PUTR on the downside that led to its lower quarterly drawdowns; it is the consistency in them that ensured PUTR having lower drawdowns in all rolling calendar quarters.
Conclusion
Many investors allocate to small-cap companies in strategic asset allocation models for more direct access to growth in local economies and greater long-term growth potential. However, investing in these companies typically comes with a price, which is higher volatility. This creates a dilemma for many investors who want to allocate to small caps but not take on additional volatility.
The WisdomTree CBOE Russell 2000 PutWrite Strategy Fund can potentially provide investors with a beta to small caps while still having lower volatility than a traditional small-cap benchmark. As we’ve experienced very robust markets over the last few years, with a lack of volatility and also extended valuations, WisdomTree believes it is a good time to consider this new fund.
1Source: Bloomberg, as of 12/31/17.
2Source: Bloomberg, as of 12/31/17.Important Risks Related to this Article
There are risks associated with investing, including possible loss of principal. The Fund will invest in derivatives, including Russell 2000 Index put options (“RUT Puts”). Derivative investments can be volatile, and these investments may be less liquid than securities, and more sensitive to the effects of varied economic conditions. The value of the RUT Puts in which the Fund invests is partly based on the volatility used by market participants to price such options (i.e., implied volatility). The options values are partly based on the volatility used by dealers to price such options, so increases in the implied volatility of such options will cause the value of such options to increase, which will result in a corresponding increase in the liabilities of the Fund and a decrease in the Fund’s NAV. Options may be subject to volatile swings in price influenced by changes in the value of the underlying instrument. The potential return to the Fund is limited to the amount of option premiums it receives; however, the Fund can potentially lose up to the entire strike price of each option it sells. Due to the investment strategy of the Fund, it may make higher capital gain distributions than other ETFs. Please read the Fund’s prospectus for specific details regarding the Fund’s risk profile.


