
Is March 2024’s Equity Performance Telling Us It’s Time for Value?
Published April 11, 2024

Global Head of Research
Key Takeaways
- In March 2024, there was a distinct shift in performance from growth-oriented strategies to value-oriented strategies in the U.S. equity market.
- After 2023 being all about the so-called Magnificent 7, it’s possible that March 2024 is signaling a broadening out of U.S. equity performance to an environment driven by more than simply the largest companies.
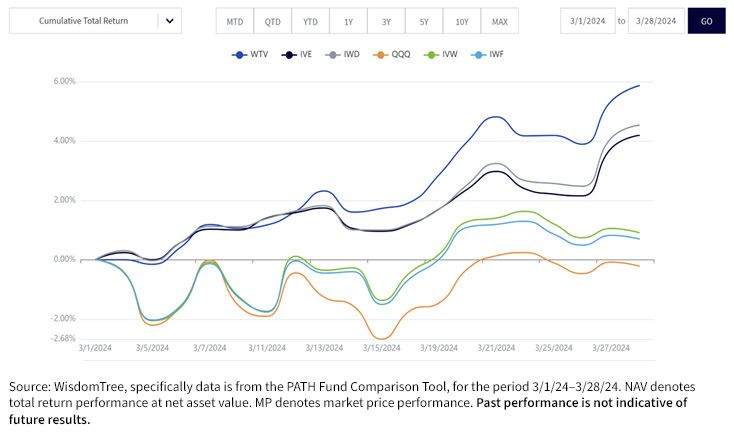
- WTV outperformed QQQ, IVW and IWF in March 2024, indicating a shift in market leadership from growth to value.
It is my fourteenth year at WisdomTree, and I feel like for the large majority of that time, growth investing has been in fashion and outperforming among U.S. equities. The Magnificent 71 of 2023 was just the most recent instance of this trend.
However, something we saw in March 2024 represented a distinct shift in this trend. The performance of value-oriented strategies accelerated.
Value Is in the Eye of the Beholder (or the Strategy Creator)
If I paused and posed the question, what is value, would you have an answer? Historically, the value factor has been defined many different ways, but one of the most long-standing definitions focuses on stocks with high book-to-market value, noting that the book value equity is the key fundamental to compare back to a measure of the market’s price.2 As is the case with almost any financial metric, this isn’t perfect—each has its own set of pros and cons.
In this piece, we focus on three distinct value strategies for U.S. equities:
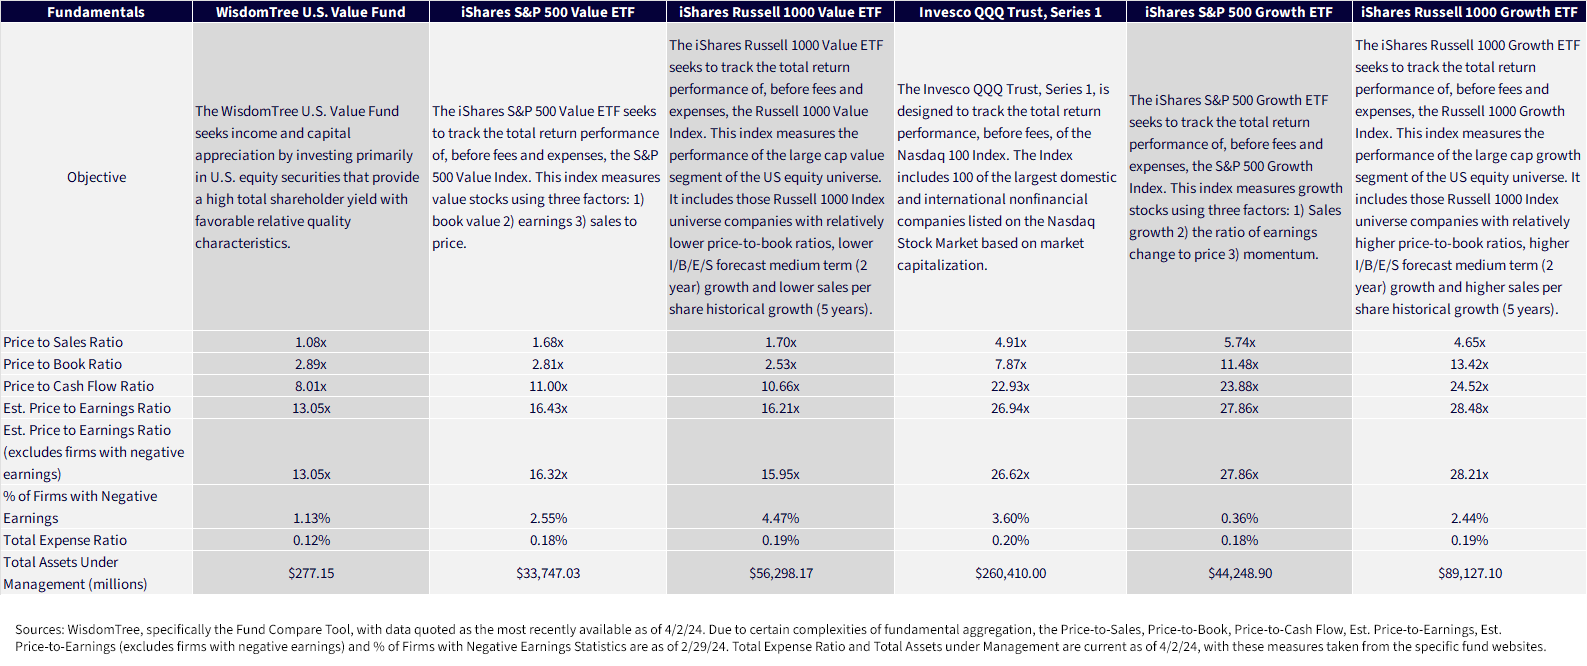
- WisdomTree U.S. Value Fund (WTV): The WisdomTree U.S. Value Fund seeks income and capital appreciation by investing primarily in U.S. equity securities that provide a high total shareholder yield with favorable relative quality characteristics.3
- iShares S&P 500 Value ETF (IVE): The iShares S&P 500 Value ETF seeks to track the total return performance, before fees and expenses, of the S&P 500 Value Index. This index measures value stocks using three factors: 1) book value, 2) earnings, and 3) sales to price.4
- iShares Russell 1000 Value ETF (IWD): The iShares Russell 1000 Value ETF seeks to track the total return performance, before fees and expenses, of the Russell 1000 Value Index. This index measures the performance of the large-cap value segment of the U.S. equity universe. It includes those Russell 1000 Index universe companies with relatively lower price-to-book (P/B) ratios, lower I/B/E/S forecast medium-term (2 year) growth and lower sales per share historical growth (5 years).5
In order to show the shift from growth to value that we saw occur in March 2024, we add three growth strategies for comparison purposes:
- Invesco QQQ Trust Series 1 (QQQ): The Invesco QQQ Trust, Series 1, is designed to track the total return performance, before fees, of the Nasdaq 100 Index. The Index includes 100 of the largest domestic and international nonfinancial companies listed on the Nasdaq Stock Market based on market capitalization.
In the figures that follow, we see a few distinct performance stories. Continuing to look at and compare these strategies could tell us a lot about how U.S. equity market leadership is evolving.
First, there is figure 1—useful in that the standardized return as of December 31, 2023, is perfect for looking at the 2023 returns. Investors look at 2023 as largely the year of the Magnificent 7.
- QQQ was the leader: We see that QQQ delivered a return of nearly 55% over the period. IWF was in second place at 42%–43%. All the other strategies were below 30%.
- WTV & IVE led the charge for value: In 2023, few were discussing value, at least performance-wise. Both strategies were in the range of 22%. IWD lagged with a return in the range of 11%.
So, in short, those of us remembering 2023, remember growth’s returns crushing value’s returns.
Figure 1: Standardized Performance
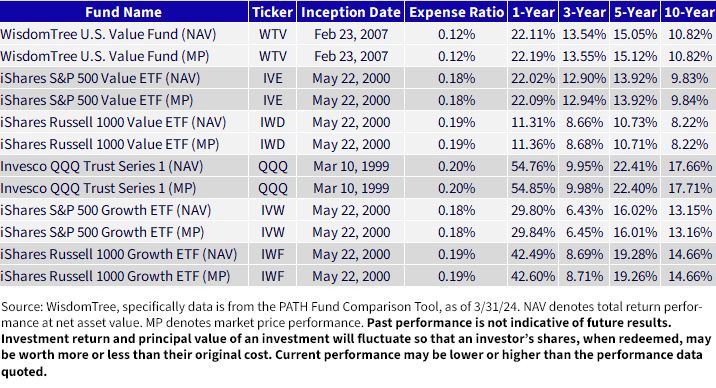
For the most recent month-end and standardized performance and to download the respective Fund prospectuses, click the relevant ticker: WTV, IVE, IWD, QQQ, IVW and IWF.
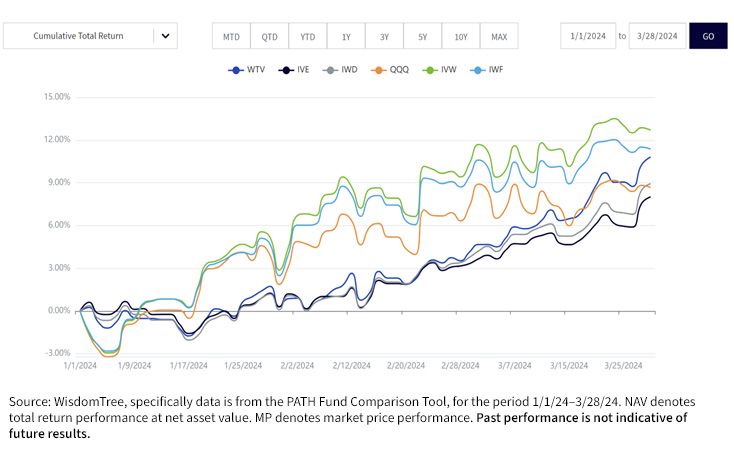
The Year-to-Date 2024 Performance Discussion
In figure 2, we see that generally the U.S. equity market has been strong in the first quarter of 2024—we are looking at three distinct value strategies and three distinct growth strategies and all six were in positive territory for this three-month period.
What’s clear is that IVW and IWF are still leading—so, over the full quarter we cannot say that the returns of value are beating the returns of growth. However, we do see that late in the first quarter, QQQ started lagging WTV and also IWD.
This is the reason why we wanted to look more closely at the month of March 2024.
Figure 2: A Strong First Quarter for U.S. Equities—Value & Growth in Positive Territory
As we shift to figure 3, which shows the performance of these strategies from March 1 to March 28, 2024, the acceleration of value over growth becomes clearer.
- WTV was the standout performer for this short period. IVE and IWD are much closer together.
- QQQ was the relative laggard. After 2023, this represents a big change. IVW and IWF were very close together, but ahead of QQQ.
Figure 3: March 2024 Saw the Shift from Growth to Value Leadership in U.S. Equities
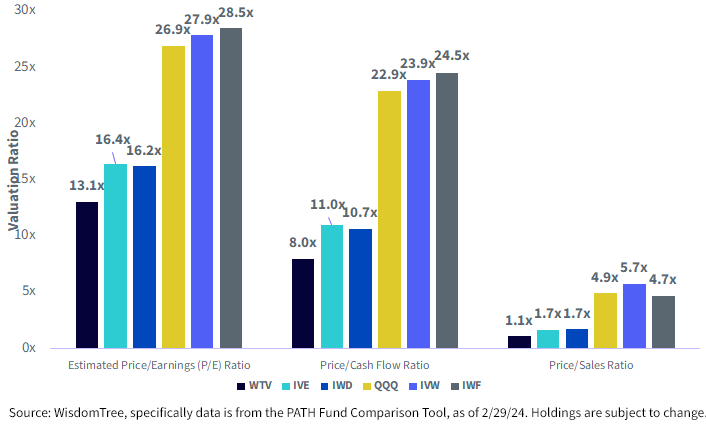
Valuation—The Question All Investors Are Asking About
We have a lot of conversations about the rally and influence of artificial intelligence (AI). Many—we believe, incorrectly—are already comparing the AI rally of 2023 and now 2024 to the Tech Bubble that formed in the late 1990s into 2000.
Given that nearly everyone is talking about this, we’d imagine that investor flows into value strategies would be stronger since these strategies are designed to steer clear of the more highly valued areas of the market.
In figure 4, we found it notable that WTV had such a lower estimated price-to-earnings (P/E) and price-to-cash flow ratio than both IVE and IWD. On a price-to-sales ratio basis, the absolute figures appear a lot closer, but on a percentage basis the difference is still stark. When people are thinking about higher valuations we believe that they are tending toward thinking about the growth side of the ledger—QQQ, IVW and IWF had much higher valuation measures across the board in figure 4.
Figure 4: The Valuation Difference between Value & Growth in U.S. Equities
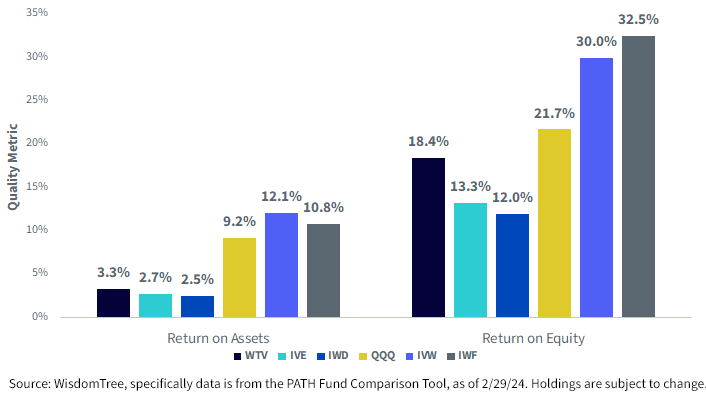
Frequently, value strategies do not pay any attention to quality, meaning things like return on equity (ROE), return on assets (ROA) and lower leverage. WTV does pay attention here, so usually this leads to a higher valuation, but it doesn’t appear that this was the case here. WTV is not able to completely close the gap relative to QQQ, IVW and IWF, but we know there will always be a gap between growth and value. What’s interesting to us is that defining value in a way that is more focused on shareholder yield is able to influence the size of this gap. In figure 5:
- When we look at WTV and QQQ specifically on a ROE basis, WTV has almost closed the gap to 3% between the two—meaning it is lagging QQQ by a bit more than 3%. We think that people will be intrigued to see that QQQ is far behind IVW and IWF on an ROE basis.
- With ROA there was less variation—the three value strategies were close together, as were the three growth strategies.
Figure 5: Return on Equity & Return on Assets, Two Important Measures of Quality
Conclusion: Value Could Be Coming Back
We’ll have to see if the second quarter of 2024 offers further confirmation of the trend of value starting to put its foot forward in U.S. equity market performance. If this ends up the case, we imagine it is a healthy sign that the same seven stocks are no longer carrying the full performance load of U.S. equities. Many people we spoke to wanted to see broader equity market leadership—maybe that is what we are seeing here.
When we think of WTV, we especially like the signal that it sends through the stocks selected—that is, companies that are focused on returning cash to shareholders. A high total shareholder yield (dividend yield and net buyback yield) is an interesting way, in our opinion, to define a value company. We believe that even if the value style does not mount a complete resurgence, this type of investing could still bring performance to the table.
Figure 6: Important Further Information Regarding the Different Strategies
1When the term “Magnificent 7” is used, it refers to 1) Apple, 2) Microsoft, 3) Amazon.com, 4) Meta Platforms, 5) Nvidia, 6) Alphabet and 7) Tesla.
2Source: https://mba.tuck.dartmouth.edu/pages/faculty/ken.french/data_library.html
3The Fund’s objective changed effective 12/18/17. Prior to 12/18/17, Fund performance reflects the investment objective of the Fund when it tracked the performance, before fees and expenses, of the WisdomTree U.S. LargeCap Value Index.
4Source: S&P Dow Jones Indices S&P 500 Value Index Factsheet, data current as of 3/28/24.
5Source: FTSE Russell Russell 1000 Value Index Factsheet, data current as of 2/29/24.
Categories
About the contributor

Global Head of Research
Christopher Gannatti began at WisdomTree as a Research Analyst in December 2010, working directly with Jeremy Schwartz, CFA®, Director of Research. In January of 2014, he was promoted to Associate Director of Research where he was responsible to lead different groups of analysts and strategists within the broader Research team at WisdomTree. In February of 2018, Christopher was promoted to Head of Research, Europe, where he was based out of WisdomTree’s London office and was responsible for the full WisdomTree research effort within the European market, as well as supporting the UCITs platform globally. In November 2021, Christopher was promoted to Global Head of Research, now responsible for numerous communications on investment strategy globally, particularly in the thematic equity space. Christopher came to WisdomTree from Lord Abbett, where he worked for four and a half years as a Regional Consultant. He received his MBA in Quantitative Finance, Accounting, and Economics from NYU’s Stern School of Business in 2010, and he received his bachelor’s degree from Colgate University in Economics in 2006. Christopher is a holder of the Chartered Financial Analyst Designation.