
Is the Fed Going to Party Like It’s 1995?
Published March 6, 2024

Head of Investment and Fixed Income Strategy
One of the more noteworthy stories for the money and bond markets thus far in 2024 is the changing perception of the Fed policy outlook. With rate cuts now being the primary focus, the conversation has revolved around when such a move could occur and what the path would ultimately look like. While Fed officials continue to acknowledge that rate cuts seem likely later this year, a more recent development in the news was the comparison to the rate cutting cycle that occurred in 1995/1996. Against this backdrop, I thought it would be interesting to provide the reader with some context and outline what Fed policy looked like nearly 30 years ago.
Before we look at the 1995/1996 experience, it is natural to ask why I am even bothering to blog on something that occurred almost three decades ago. Does it really have any relevance to 2024? Well, the reason is quite simple. The Fed has seemingly been united in its recent messaging that monetary policy, aka rate cuts, this year can be “methodical,” “cautious,” and “patient,” but Vice Chair Jefferson recently introduced a new aspect to the discussion when he mentioned the mid-1990’s rate cutting episode might be the best parallel to the current situation. Specifically, that policy easing occurred due to lowering inflation, not economic weakness, i.e., a soft landing.
Fed Funds Target Mid Point of Range
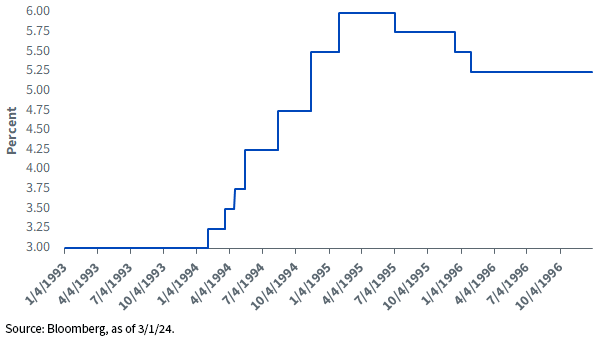
OK, so what happened in the mid-1990s? First up, the Fed embarked on an aggressive tightening cycle in 1994/1995. Indeed, the policy maker raised the Fed Funds target by 300 basis points (bps), with the rate hikes ultimately reaching a peak of 6%. Interestingly, the rate hike intervals themselves somewhat resembled the episode that recently transpired, as 25-bp increases at the start of the 1994/1995 cycle shifted into higher gears of 50-bp and then 75-bp moves—sound familiar?
By mid-1995, the Fed had embarked on a rate cut policy. However, as highlighted by the above graph, the decline in the Fed Funds target was not uniform in any fashion. The first 25-bp decrease came in July of that year, but the next quarter-point move didn’t occur until five months later in December. The final rate cut in this easing cycle came in late January 1996, another 25-bp move, which took the Fed Funds Rate down to 5.25%. To sum it up, the 1995/1996 rate cut episode consisted of only three decreases worth 75 bps in total.
Presently, as we’ve discussed over the last few months, the market has finally “come to the Fed” with respect to rate cut expectations for 2024. In other words, as February came to a close, implied probabilities for Fed Funds Futures saw only three rate cuts this year, just like the Fed’s latest dot-plot. Remember, we came into this year with the market pricing in six rate cuts.
Conclusion
If you want some further interesting context, the 2019/pre-COVID-19 rate cut cycle also consisted of only three rate cuts, and it also began in July, like in 1995. By the way, this was another non-recession-induced rate cut timeframe as well. Now, I’m not saying this is going to be the template for this year, but you have to admit these are interesting little monetary policy tidbits. The bottom line is that any potential rate cuts for 2024 are going to be data-dependent, and thus far, the soft-landing scenario has been aligning with what occurred nearly 30 years ago. Does that mean that three rate cuts beginning at this year’s July FOMC meeting should be a given? Stay tuned…
About the contributor

Head of Investment and Fixed Income Strategy
Kevin serves as the Head of Investment and Fixed Income Strategy. In this role, he writes macro and fixed income-related content and works closely with the sales, research and marketing teams. In addition, Kevin conducts client-facing webinars and meetings, providing expertise on WisdomTree’s existing and future bond ETFs. Prior to joining WisdomTree, Kevin spent 30 years at Morgan Stanley, where he was Managing Director and Chief Fixed Income Strategist for Wealth Management. He was responsible for tactical and strategic recommendations and created asset allocation models for fixed income securities. He was a contributor to the Morgan Stanley Wealth Management Global Investment Committee, primary author of Morgan Stanley Wealth Management’s monthly and weekly fixed income publications, and collaborated with the firm’s Research and Consulting Group Divisions to build ETF and fund manager asset allocation models. Kevin has an MBA from Pace University’s Lubin Graduate School of Business, and a B.S. in Finance from Fairfield University.