
Value Strikes Back


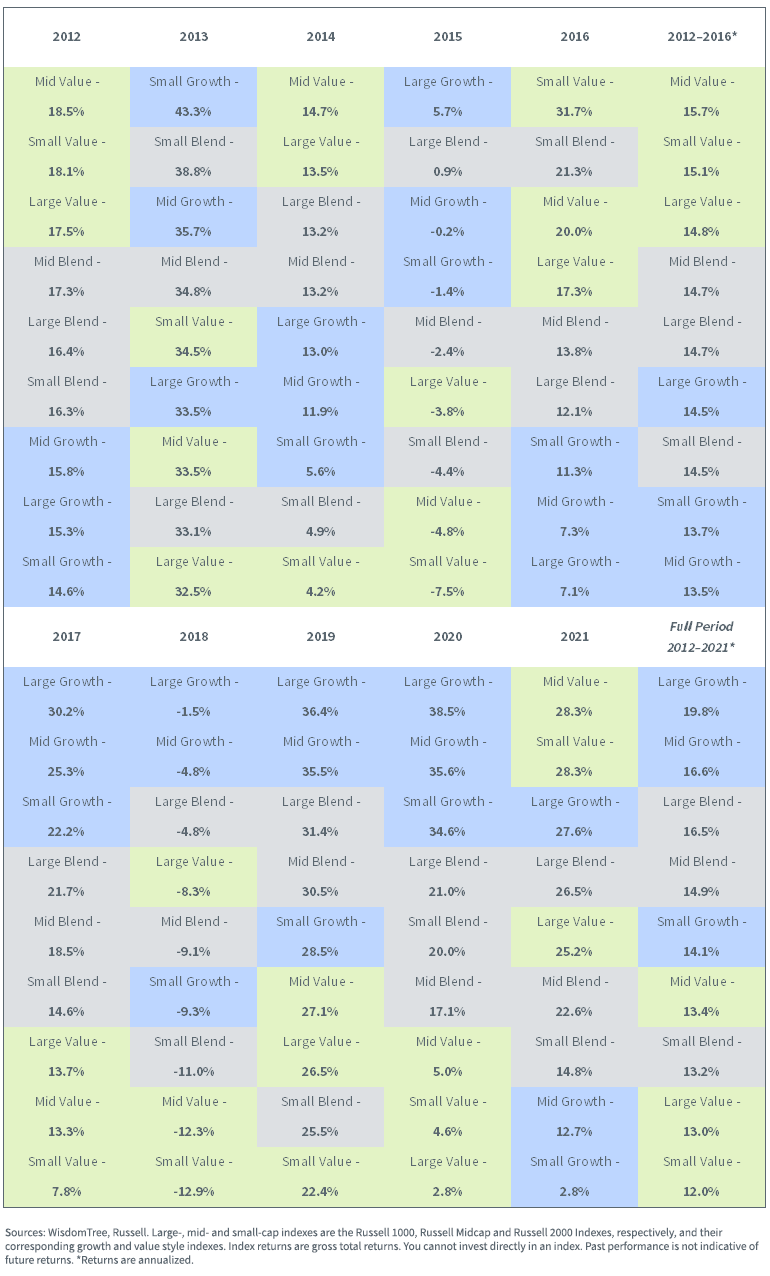
Large-cap growth stocks outperformed small-cap value stocks by over 700 basis points (bps) annualized from 2012 to 2021.1
This stretch of whopping outperformance—a cumulative gain of 508% for large growth versus 211% for small value—stands in stark contrast to the findings of academic research into long-run historical returns.
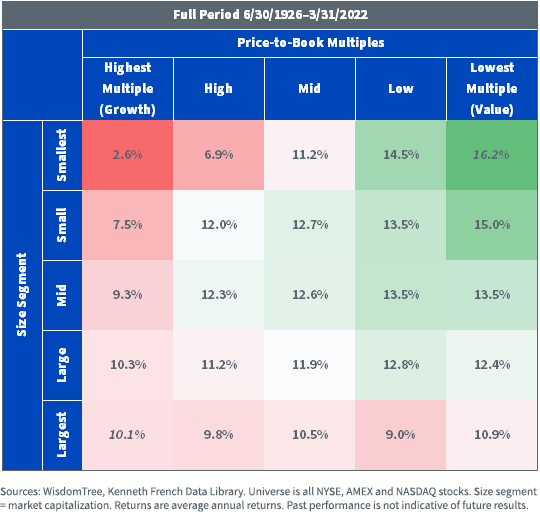
The table below shows the historical returns of U.S. equities sorted into 25 portfolios by price-to-book and market cap from the Kenneth French Data Library.
The returns for these portfolios show a clear trend toward increasing returns for portfolios with lower price-to-book multiples (more value) and smaller market caps.2
The spread in returns between the portfolio in the top right corner (lowest price-to-book and smallest size) and the bottom left corner (highest price-to-book and largest size) was over 600 bps annualized.
Fama/French U.S. 5x5 Portfolios: Size x Price-to-Book
Value Reversal
While it has felt like a long winter for value investors, the reality is that growth outperformance only took off in the four-year stretch between 2017–2020 and was supercharged by the economic circumstances of the Covid-19 pandemic, which favored “stay-at-home” friendly growth stocks.
In fact, between 2012 and 2016, value had a five-year stretch of outperformance over growth across large-, mid- and small-caps.
Trailing 10-Year Style Box Returns: 2012–2021
With the resounding comeback of value in recent months, the question is, was the 2017–2020 period of outperformance for growth more of an anomaly, like past periods of sharp outperformance of growth stocks such as the late ‘90s/early 2000s tech bubble?
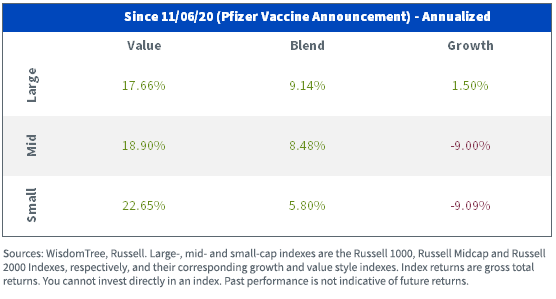
To put the magnitude of this reversal into some context, since the final trading day before the Pfizer vaccine announcement in November 2020, small-cap value has outperformed large-cap growth by an eye-popping 21.15% annualized.
Russell Style Index Returns, as of 5/10/22
Dividends as Measure of Value
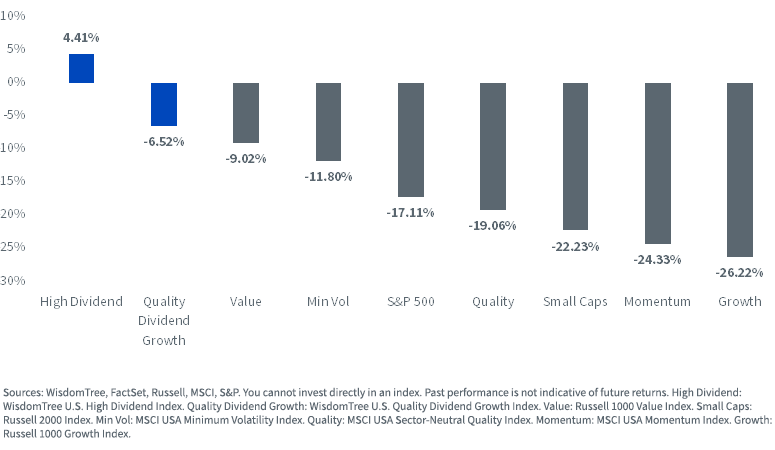
With value beating growth by over 17% year-to-date,3 dividend-oriented indexes, which tend to have high overlap with traditional value indexes, have fared even better. High dividend equities are up over 4% and quality dividend growth stocks have outperformed the S&P 500 by 10.59%.
According to Bank of America Quant Research, the high dividend yield factor was the best-performing factor year-to-date through April of all approximately 50 equity factors it tracks.4
U.S. Factor Return YTD, as of 5/13/22
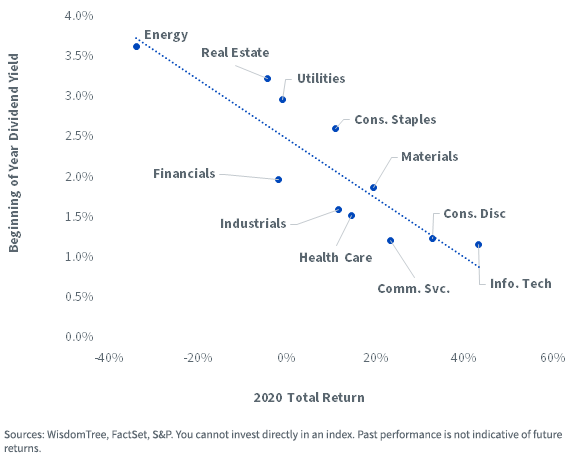
The outperformance of high dividends is a reversal of what worked in 2020. That year, there was a clear negative relationship between a sector’s dividend yield and total returns as investors favored high-growth “story” stocks.
2020: Low Dividend Yielding Sectors Performed Best
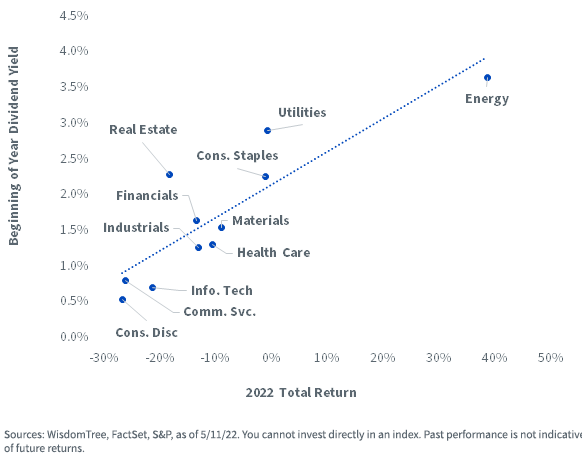
This year, the trendline has been flipped. Now there’s a positive and upward sloping relationship between a sector’s dividend yield and total return, as investors have shifted toward favoring cash flows.
2022 Highest Dividend Yield Sectors Performed Best
What’s Next?
There is a compelling case that the factors contributing to the outperformance of dividend stocks this year seem likely to persist:
- Higher rates: As the Fed aggressively hikes short-term rates it stands to reason investors will prefer the current cash flows of dividends over the uncertainty of non-dividend-paying growth stocks.
- Inflation protection: Dividend growth has historically outpaced inflation. Because stocks are real assets with profits that increase with inflation, dividend payouts also grow with inflation—unlike bond coupons.
- Economic slowdown: The U.S. economy registered negative growth in the first quarter, raising the prospects that the economy may be in—or entering—a soft patch. During economic slowdowns investors tend to prefer the relative safety of dividend payments.
For more information on dividends and the performance of dividend-paying equities, check out our monthly Dividend Monitor.
1 Comparing Russell 2000 Value to Russell 1000 Growth Total Returns.
2 The outlier to this trend is the underperformance of smaller market-cap portfolios in the highest and high price-to-book segments. The expected positive size effect does not offset the negative expected effect of a higher price-to-book multiple and leads to lower returns in the highest price-to-book portfolios when going down the size segments.
3 Comparing Russell 1000 Value to Russell 1000 Growth Total Returns.
4 Bank of America Global Research, “Quantitative Profiles: Welcome to a Total Return World,” 5/11/22.
Share & Comment
Popular Posts
Categories
Related Links