

When Do Capital-Efficient Strategies Disappoint?
Published January 11, 2022

Jeremy Schwartz, CFA
Global Chief Investment Officer

Matt Wagner, CFA
Director, Research
Two questions often come up about our capital-efficient family of ETFs: “How do I use these in a total portfolio context?” and “When will they break down or underperform/disappoint investors?”
These two questions are related. How one uses capital-efficient strategies in a portfolio will dictate when things go wrong.
The Efficient Core family of ETFs—now with options for U.S., developed international and emerging markets and having recently surpassed the $1 billion milestone for assets invested across the family—is structured so that for every $1 invested, we have $1.50 of asset exposure: 90 cents of equities and 60 cents of bond futures.
Efficient core stands for “capital efficient” at the core of your portfolio—designed to allow you to put up less capital to get the same desired total exposure.
In that context, investors are replacing both traditional stock and bond exposures with WisdomTree Efficient Core ETFs—freeing up capital and room in their portfolios for other strategies.
For example, if you held a portfolio with two assets—$60 of S&P 500 stocks and $40 of bonds (the classic 60/40)—you could instead put $66.67 in our capital-efficient core ETFs and achieve the approximate 60/40 allocation with $33.33 left to be allocated elsewhere.
Holding cash has the value of choice. The cash can be used for spending—while preserving your overall portfolio allocations—or it can be used to fund other private investments or alternative strategies.
So, when asked, “When will capital efficient strategies disappoint?” I deflect the question back to, “What else did you do with your portfolio?” Because it really is meant to proxy the core equity/bond portfolio betas, and it is all about what are you doing with that $33.33 of freed-up capital.
What about the 100% Equities Comparison?
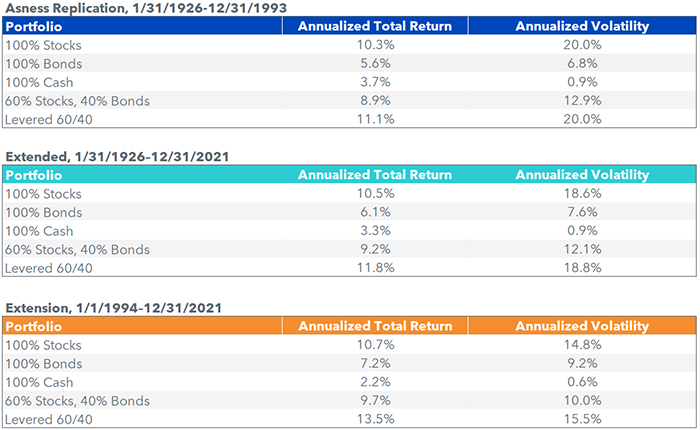
The original Cliff Asness research behind a levered 60/40 compared a 155% levered 60/40 to a 100% equities allocation—and here, the question of “When will it fail to work?” comes down to what happened to interest rates and bond returns.
When we launched the WisdomTree U.S. Efficient Core Fund (NTSX) more than three years ago, we replicated the results of the Cliff Asness 1996 paper that compared a 155% levered 60/40 to a 100% equities allocation.
Asness had evaluated returns from 1926–1993 and determined the leverage ratio when applied to a 60/40 that would equate risk levels of a 60/40 with a 100% equities allocation.
In Cliff’s original work, the levered 60/40 added about 80 basis points (bps) over a 100% equities allocation. From January 1994 to December 2021, the levered 60/40 actually did 280 bps better than the 100% equities allocation. That is, the research worked better after he published his original results than in the prior 67 years. That almost never happens in the research world, where studies “fail to replicate” out of sample.
But coming back to when did the Asness levered 60/40 “not work”?
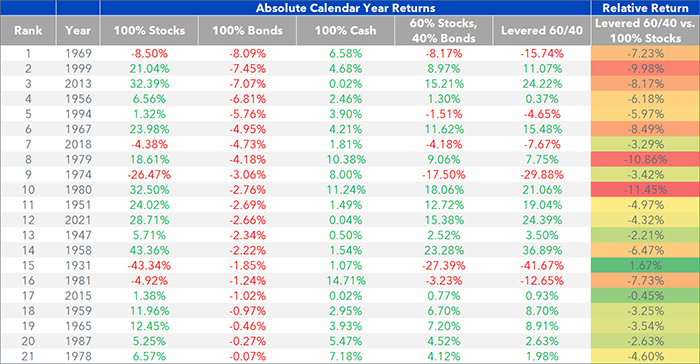
- Only in 21 out of 95 years (22%) and seven of the last 40 years (18%) was the bond return negative—the worst year was -8.09% in 1969
- Only in five years was the bond return down more than 5% (1956, 1969, 1994, 1999, 2013)
- Just once (1979–1980) was the two-year return down more than 5% when combining the negative return year with the following year’s return
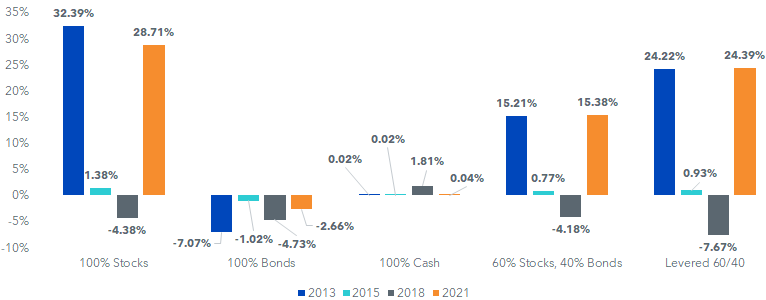
- There have been four years of negative bond returns in the past 20 years
- 2013: 100% Bonds down 7.07%, Levered 60/40 up 24.22%
- 2015: 100% Bonds down 1.02%, Levered 60/40 up 0.93%
- 2018: 100% Bonds down 4.73%, Levered 60/40 down 7.67%
- 2021: 100% Bonds down 2.66%, Levered 60/40 up 24.39%
Calendar Year Returns
Below is a table of all 21 negative return years for the 100% bonds allocation.
2021 shows up on this list in the 12th spot—with a decline of 2.66%.
Does that say anything about the future?
Following these negative return years—with 20 observations, since 2022 returns are unknown—in 16 of the next 20 (80% of the time), bond returns were positive and made up for the losses in 14 of the 20 (70% of the time).
Negative Return Years for 100% Bonds
The current macro environment: more rising rates?
Our current house macro view—best told by our Senior Investment Strategy Advisor, Jeremy Siegel—is that inflation will run hot for an extended period, and this will likely pressure traditional bond portfolios.
We have advocated that the legacy 60/40 should morph toward a 75/25 for many investors.
We believe our capital-efficient strategies are best used to free up capital for other diversifiers and not just to layer bond beta risk on top of your equities.
But for those 60/40 investors who want to take the 75% equity risk and not sacrifice the bond exposure and potential portfolio diversification benefits, capital-efficient strategies can allow allocations like 75/40—or 115% total asset exposure of the capital invested.
Bonds have historically provided a ballast to portfolio diversification, and one of the reasons we see bond yields being so depressed is that the hedge bonds provide to traditional equity portfolios make them a desirable asset to hold for some investors. Our capital-efficient ETFs use bond futures in exactly that diversifying way.
Sources for all tables and chart: WisdomTree, Ibbotson, Morningstar Direct, as of 12/31/21. “Asness Replication” based on 1996 article by Cliff Asness titled “Why Not 100% Equities?” and published in The Journal of Portfolio Management. 100% Stocks measured by Ibbotson US Large Stock Total Return Index. 100% Bonds measured by Ibbotson Long-Term Corporate Total Return Index. 100% Cash (the borrowing rate used for leveraging 60/40) measured by Ibbotson 30-Day T-Bill Index. Past performance is not indicative of future results. You cannot invest directly in an index. Index performance does not represent actual fund or portfolio performance. A fund or portfolio may differ significantly from the securities included in the index. Index performance assumes reinvestment of dividends but does not reflect any management fees, transaction costs or other expenses that would be incurred by a portfolio or fund, or brokerage commissions on transactions in fund shares. Such fees, expenses and commissions could reduce returns. WisdomTree, its affiliates and their independent providers are not liable for any informational errors, incompleteness or delays or for any actions taken in reliance on information contained herein. The research shown is not a back test or hypothetical representation of NTSX.
Important Risks Related to this Article
There are risks associated with investing, including possible loss of principal. While the Fund is actively managed, the Fund’s investment process is expected to be heavily dependent on quantitative models, and the models may not perform as intended. Equity securities, such as common stocks, are subject to market, economic and business risks that may cause their prices to fluctuate. The Fund invests in derivatives to gain exposure to U.S. Treasuries. The return on a derivative instrument may not correlate with the return of its underlying reference asset. The Fund’s use of derivatives will give rise to leverage, and derivatives can be volatile and may be less liquid than other securities. As a result, the value of an investment in the Fund may change quickly and without warning, and you may lose money. Interest rate risk is the risk that fixed income securities, and financial instruments related to fixed income securities, will decline in value because of an increase in interest rates and changes to other factors, such as perception of an issuer’s creditworthiness. Please read the Fund’s prospectus for specific details regarding the Fund’s risk profile.
Neither diversification nor an asset allocation strategy assures a profit or protects against investment losses.
Categories
Related articles
The Periodic Table Has a Hidden Power Structure

Trump, Xi, and the Strategic Processing Reserve
Adding Alpha to Beta: A Capital-Efficient Solution

The Strategic Metals Underpinning Our Modern Technologies
Gold Monthly: Rebounding after a Violent Drawdown
Adding, Not Replacing: Gold in the Age of Efficient Capital
Adding, Not Replacing: Managed Futures in the Age of Efficient Capital
Adding, Not Replacing: Broad Commodities in the Age of Efficient Capital

The Month Gold Broke: Five Lessons from the ‘March Madness’ Selloff and the Rebound Opportunity
About the contributors

Jeremy Schwartz, CFA
Global Chief Investment Officer
Jeremy Schwartz has served as Global Chief Investment Officer since November 2021 and leads WisdomTree’s investment strategy team in the construction of WisdomTree’s equity Indexes, quantitative active strategies and multi-asset Model Portfolios. Jeremy joined WisdomTree in May 2005 as a Senior Analyst, adding Deputy Director of Research to his responsibilities in February 2007. He served as Director of Research from October 2008 to October 2018 and as Global Head of Research from November 2018 to November 2021. Before joining WisdomTree, he was a head research assistant for Professor Jeremy Siegel and, in 2022, became his co-author on the sixth edition of the book Stocks for the Long Run. Jeremy is also co-author of the Financial Analysts Journal paper “What Happened to the Original Stocks in the S&P 500?” He received his B.S. in economics from The Wharton School of the University of Pennsylvania and hosts the Behind the Markets podcast. Jeremy is a member of the CFA Society of Philadelphia.

Matt Wagner, CFA
Director, Research
Matt Wagner joined WisdomTree in May 2017 as an Analyst on the Research team. He currently serves as a Director, where he supports the creation, maintenance, and reconstitution of WisdomTree’s indexes and actively managed ETFs. Matt began his career at Morgan Stanley, working as an analyst in Treasury Capital Markets from 2015 to 2017, focusing on unsecured funding planning, execution, and risk management. He graduated magna cum laude from Boston College in 2015 with a B.A. in International Studies, concentrating in Economics. In 2020, he earned a Certificate in Advanced Valuation from NYU Stern. He is also a Chartered Financial Analyst (CFA) charterholder.