
The One Common Denominator: Fed Policy


Well, Election Day 2020 sucked all the air out of the room, to say the least. As we await election results, there’s another force in Washington, DC, to be ever mindful of in bond land: the Federal Reserve (Fed). As we blogged about over the last few weeks, the one common denominator regardless of the election outcome is monetary policy, and the Fed’s new framework will continue to come into focus.
For the record, there is an FOMC meeting taking place, with the outcome of this convocation going into headline mode tomorrow. Given the Fed’s moves up to this point and their shift in how policy will be implemented, it seems highly likely the money and bond markets will not see anything noteworthy from the voting members this time around.
U.S. Treasury 2-Year vs. 10-Year
Against this backdrop, let’s turn our attention to the U.S. Treasury (UST) market and how the Fed’s new policy framework could potentially impact yields going forward. Certainly, the policy makers will not be leaving their zero interest rate policy (ZIRP) any time in the foreseeable future, but that doesn’t mean the UST 10-year yield can’t move or the yield curve won’t be impacted as a result.
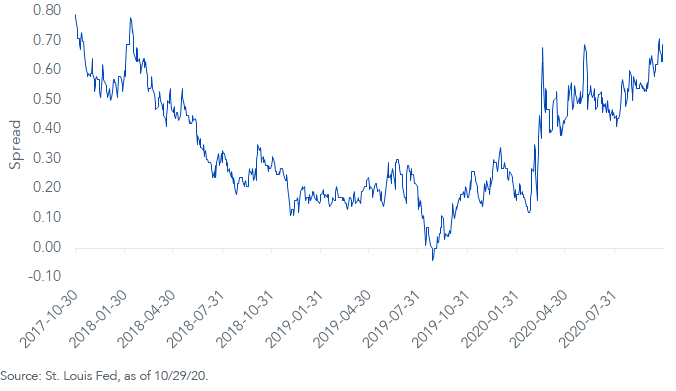
The month of October provided a clear-cut illustration of these possibilities. To give some perspective, the UST 10-year yield rose by 20 basis points (bps) during the month, coming in within hailing distance of 0.90%. As a result, the yield curve steepened, with the UST 2yr/10yr spread increasing to its widest level in two years (see graph). In fact, even though it’s come in “fits and starts,” the Treasury yield curve has actually been on an ascending trajectory for more than a year now. After being inverted by almost -5 bps in late summer 2019, the 2s/10s spread moved back up over +70 bps just two weeks ago.
Conclusion
Is this steepening in the yield curve telling us anything? As I blogged about a number of months ago, yield curve signals may not have the same meaning as in the past, with the Fed buying Treasuries on their balance sheet at a record clip.
However, the increase in the UST 10-year yield does bear watching, in my opinion. The U.S. economy has thus far bounced back much more quickly from the shutdown than just about any economist expected. Q3 real GDP produced a record +33.1% surge, more than offsetting the -31.4% record plunge in Q2. Sure, we’re still 3.5% below the pre-pandemic Q4 reading, but recouping this lost output by mid-2021 now seems the more “reasonable” case scenario rather than by the end of next year. Interestingly, the question has now become: Can real GDP get back to pre-pandemic levels even sooner?
With the Fed’s new aggressively accommodative monetary policy and the prospect of additional fiscal stimulus now that the election is over, investors should consider positioning their fixed income portfolio for further steepening in the months ahead.
Unless otherwise stated, all data sourced is St. Louis Fed, as of October 29, 2020.
Share & Comment
Popular Posts
Categories
Related Links