
The WisdomTree Mid-Year Economic Outlook: The Good, the Bad and the Ugly


We just endured a horrible first half of the year, caused by the global pandemic.
The first quarter was bad, and the second quarter was ugly.
But we now see signs of recovery.
As the economy slowly reopens (with stops and starts as new cases of the virus flare up—which is inevitable until we have a vaccine), we envision a gradual improvement to GDP. While the data resembles a “V”-shaped recovery, it may actually feel more like a “U.” The bottom line is we expect to see growth resuming in the second half of the year. But, given the depth of the Q2 “GDP crater,” a return to pre-COVID 19 levels may not occur until 2021.
The steepness of the recovery slope depends on consumers’ willingness to come out of their homes and resume spending. Monetary and fiscal stimulus (with more to come) has injected an enormous amount of liquidity into the system, with much of it going directly to consumers. We expect this stimulus to support a nice recovery.
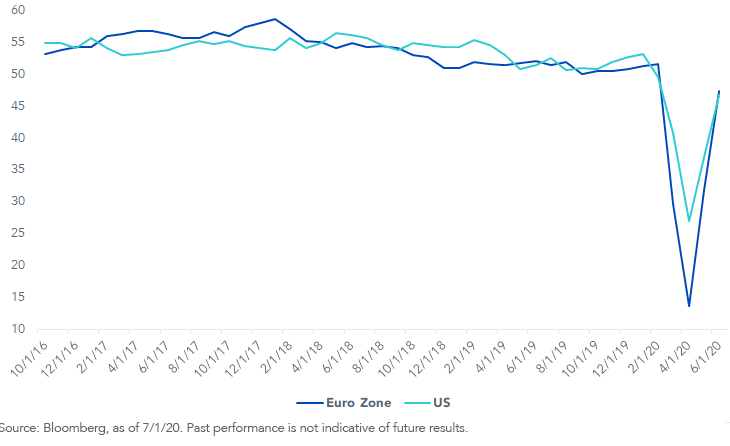
Overall business activity in both the U.S. and the eurozone has increased since bottoming this spring. The most recent (June) PMI reports certainly resemble a V shape (a recurring theme), as both the manufacturing and service sectors bounce back. In fact, the latest manufacturing data from the Institute for Supply Management (ISM) showed that the U.S. moved back into expansionary territory with a figure of 52.6—the highest since April of last year (any reading above 50 is considered expansionary).
Not surprisingly, the service sectors of the economy took the biggest pandemic-related hits. But even the ISM Non-Manufacturing (Services) indicator has climbed back into expansionary territory.
U.S. Eurozone PMI's
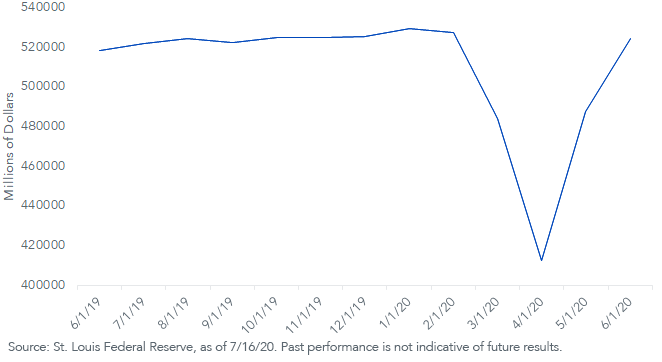
From a personal consumption perspective, retail sales bounced back strongly in the past few months and have essentially regained their levels from just prior to the onset of the pandemic.
Advanced Retail Sales
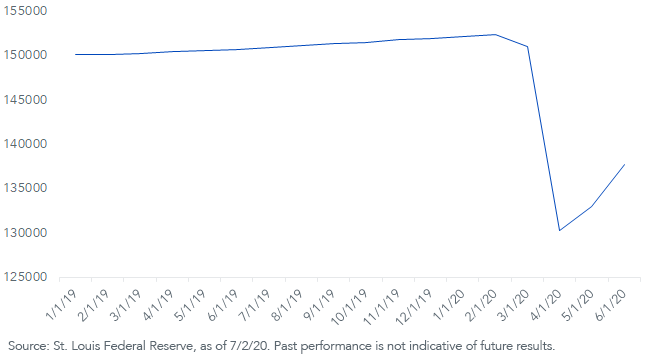
Obviously, the state of the labor force will be a key factor moving forward. While the government’s fiscal response has provided much-needed relief, the “job growth engine” needs to turn back on to generate sustainable growth. Additional stimulus is more than likely, but it is not a sustainable solution—jobs are.
The June Employment Situation report showed further progress, but it also highlighted how much further we need to go. The May/June combined payroll gain was about 7.5 million, but the March/April combined job losses were 22.2 million. So, we have recouped only about one-third of the job losses previously incurred.
Total Nonfarm Payrolls
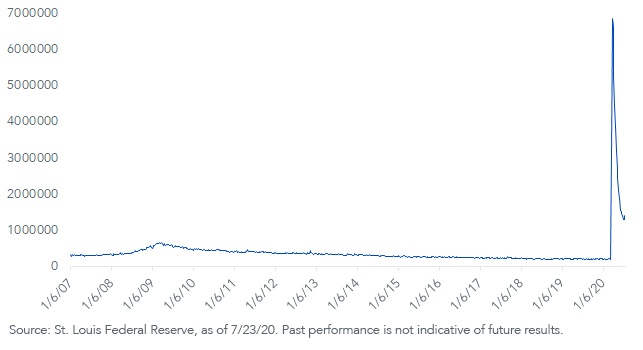
Weekly jobless claims are a key economic indicator to watch going forward. The lion’s share of data releases investors receive are lagging indicators—they measure what happened in the past. Jobless claims, however, are a leading indicator, and one of the most “current” indicators we can observe. In fact, it is part of the Leading Economic Indicators Index . After forming a “reverse V,” the decline in the number of new claimants stalled out in recent weeks.
For the broader jobs market, the recent increase in COVID-19 cases and attendant effects on reopenings could make it a bit choppier in the coming months. But we still see the overall trend as one of improvement.
Weekly Jobless Claims
In summary, after a bad -5.0% for Q1 GDP, the Wall Street Journal reports a consensus estimate of a dismayingly ugly -33.5% GDP for Q2, but then an equally uplifting and good +14.5% for Q3 and +7.5% for Q4, bringing the annual GDP for 2020 to an estimated -5.9%.1
Barring a second government-mandated economic lockdown, we believe we will see a slow-but-steady recovery of the U.S. economy in the second half of 2020.
You can check out our full mid-year outlook here.
1The Wall Street Journal Economic Forecasting Survey, as of 7/1/20.
Share & Comment
Popular Posts
Categories
Related Links
Rick Harper serves as the Chief Investment Officer, Fixed Income and Model Portfolios at WisdomTree Asset Management, where he oversees the firm’s suite of fixed income and currency exchange-traded funds. He is also a voting member of the WisdomTree Model Portfolio Investment Committee and takes a leading role in the management and oversight of the fixed income model allocations. He plays an active role in risk management and oversight within the firm.
Rick has over 29 years investment experience in strategy and portfolio management positions at prominent investment firms. Prior to joining WisdomTree in 2007, Rick held senior level strategist roles with RBC Dain Rauscher, Bank One Capital Markets, ETF Advisors, and Nuveen Investments. At ETF Advisors, he was the portfolio manager and developer of some of the first fixed income exchange-traded funds. His research has been featured in leading periodicals including the Journal of Portfolio Management and the Journal of Indexes. He graduated from Emory University and earned his MBA at Indiana University.