
The 2020s Long Game: Large-Cap Growth vs. Small-Cap Value


“Unchanged over a generation.” This bull market was so legendary that even after the crash, not many U.S. stock market indexes could make that claim.
Yet that was exactly the case at the depths of Covid-19 fear, when the Russell 2000 Value Index of U.S. small caps briefly traded at levels last seen in 2007.
Granted, 2007 isn’t the most encouraging of years for a bull case—the stock market peaked that year, and then the financial system fell apart.
But if you think that’s discouraging, wait until I tell you about another part of the U.S. stock market. The Russell 1000 Growth Index ran so much higher last year that the Covid-19 crash could only bring it back to 2018 levels. Now that the market is rallying, the Index is on the precipice of being unchanged so far in 2020 (figure 1).
Figure 1: Russell 1000 Growth Index vs. Russell 2000 Value Index
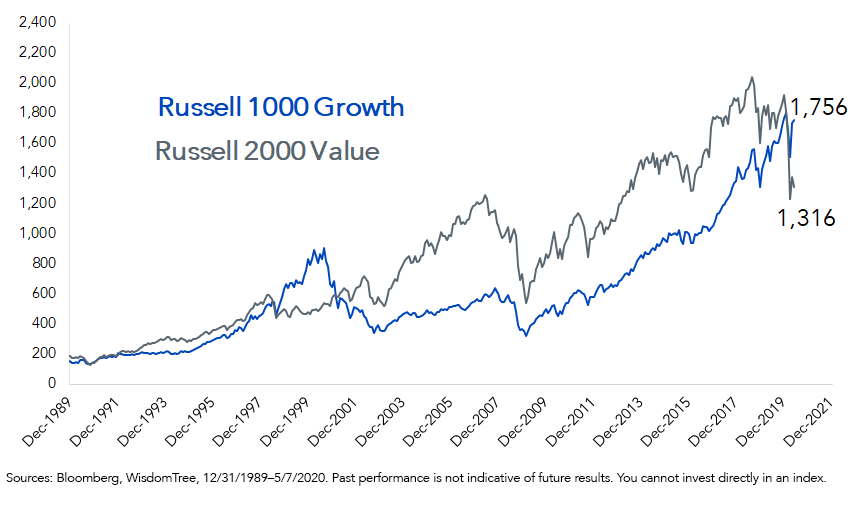
What we have is a bubble—at least a relative one—between the do-no-wrong large-cap growth portion of the U.S. stock market and the can’t-do-right small-cap value leper.
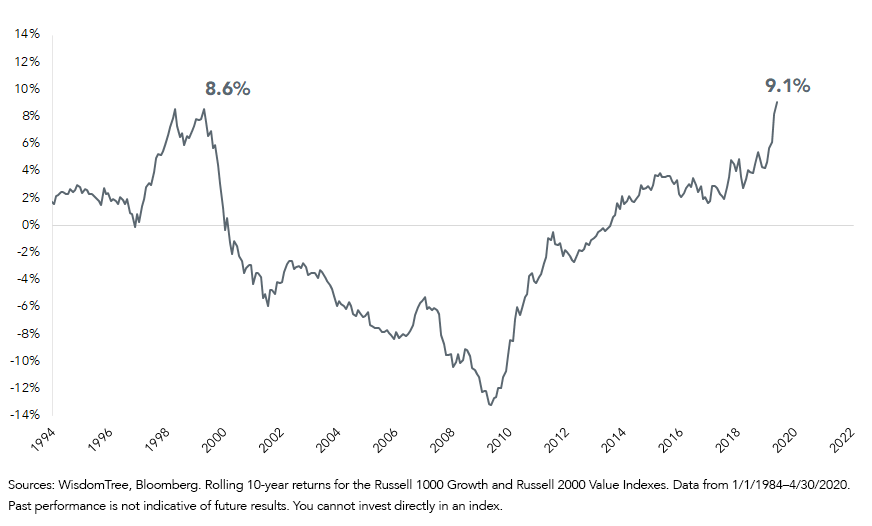
I’m not saying this is the dot-com bust reincarnated, but let’s acknowledge the facts: There hasn’t been a 10-year clobbering of small-cap value by large-cap growth like this since the absolute final stages of the 1990s tech bubble (figure 2).
Figure 2: 10-Year Annual Outperformance, Russell 1000 Growth vs. Russell 2000 Value
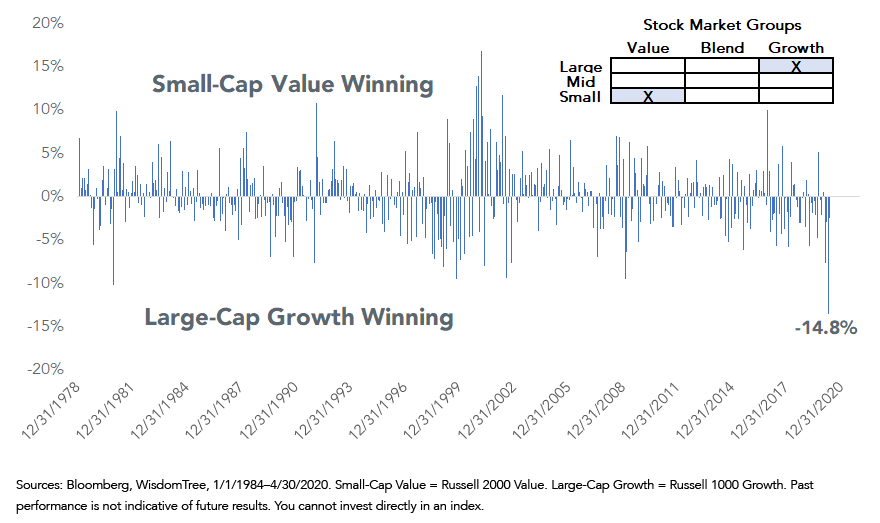
For those looking for an indication of end-of-days exhaustion between these two, consider the 14.8% performance gap in March, which was followed by another 2.5% in April. The only thing like this was the opposite side of the coin: various months in the 2000–2002 crash that witnessed small-cap value holding up while large-cap growth bled (figure 3).
Figure 3: Monthly Performance Differential, Small-Cap Value vs. Large-Cap Growth
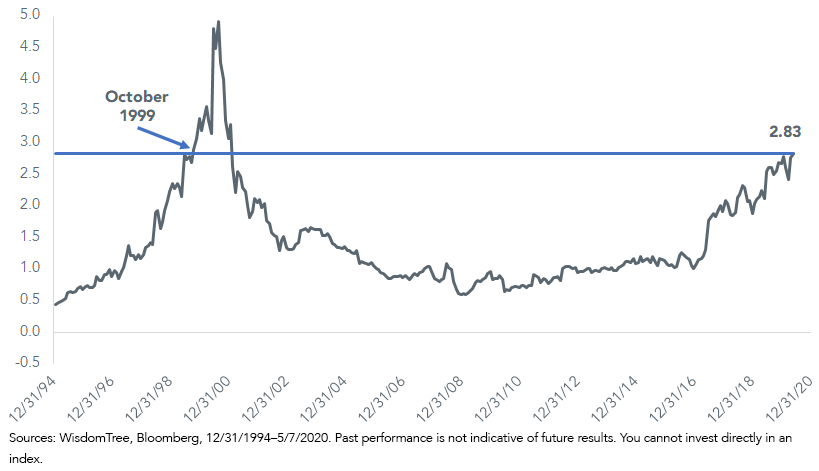
The valuation divergence is stark. With 2020 earnings uncertain because of the Covid-19 shutdowns, look at price-to-sales ratios (P/S). The gap between small-cap value’s 0.60 P/S ratio and large-cap growth’s 3.43 P/S ratio is 2.83. Though that is not as yawning as it was at the absolute apex of the dot-com bubble, it may not be wise to wait around to see if the differential can keep growing (figure 4).
Figure 4: Russell 1000 Growth Index Price-to-Sales Ratio Minus Russell 2000 Value
Now do it versus the WisdomTree U.S. SmallCap Dividend and WisdomTree U.S. MidCap Dividend Indexes, which go back to 2006. I wonder what our business will look like in the next 14 years if figure 5 reverts.
Figure 5: Russell 1000 Growth Price-to-Sales Premium to WisdomTree Indexes
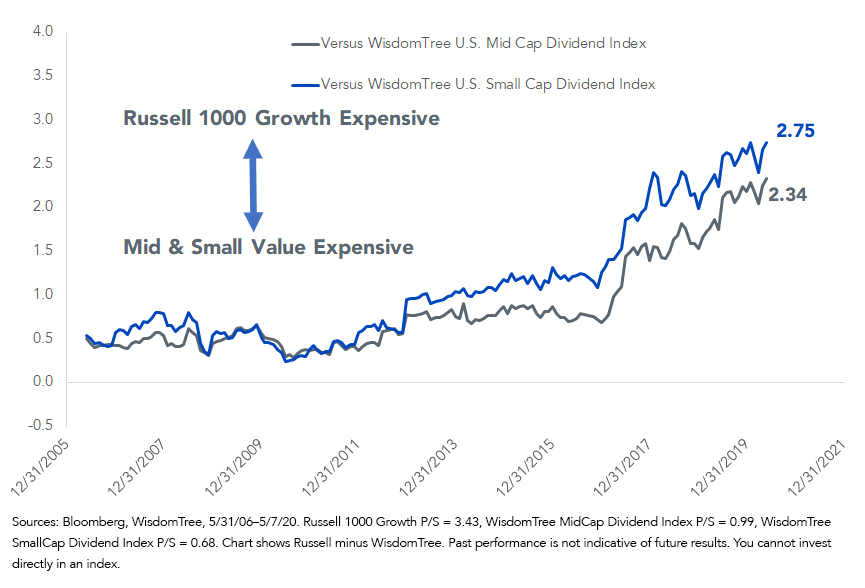
With investors questioning the viability of dividends amid political pushes for payout cuts, think about some math. Our mid-cap dividend index has a dividend yield of 4.5%. Many companies will cut or eliminate payments—that is the sober truth. But how much? Even if you slice payments by half, the resulting 2.3% yield is still higher than what could be obtained in the no-cuts 2.1%-yielding S&P 500 Index of large caps.
One more thing: Investors need to make sure they know what they own, because something is amiss inside the Russell 2000. Consider something “normal.” Figure 6 shows how Morningstar’s quant work places the Russell Midcap Index and the collection of mid-cap “blend” funds roughly in the center of the left-right spectrum, where you would expect them.
Now look at the Russell 2000 and the rest of the so-called small-cap “blend” funds in figure 7. Shouldn’t they be in the center of the bottom row, not over on the right side? So much for “blend” indexes and funds.
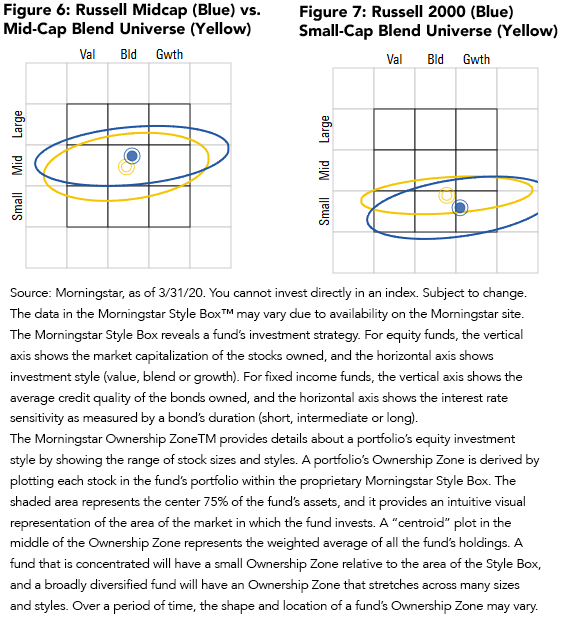
It boils down to this: It may be time to consider a generational move out of the “upper right” to the “lower left” of the classic Morningstar Style Box. In the meantime, make sure that in doing so you actually end up in the style box that you are seeking. I suspect there are a lot of investors who are holding “small-cap value” and “small-cap blend” funds that are actually engaging in quasi-growth strategies.
The WisdomTree ETFs that seek to track price and yield performance, before fees and expenses, of the WisdomTree Indexes mentioned in this blog are:
The WisdomTree U.S. SmallCap Dividend Fund (DES)
The WisdomTree U.S. MidCap Dividend Fund (DON)
Unless otherwise stated, all data as of May 11, 2020.
Important Risks Related to this Article
There are risks associated with investing, including possible loss of principal. Funds focusing their investments on certain sectors and/or smaller companies increase their vulnerability to any single economic or regulatory development. This may result in greater share price volatility. Please read the Fund’s prospectus for specific details regarding the Fund’s risk profile.
Share & Comment
Popular Posts
Categories
Related Links