
These Charts Could Point to Further Highs


One of the technical analyst teams we follow closely is JC Parets, Chartered Market Technician (CMT), and All Star Charts. All Star Charts is a technical analysis blog that attempts to forecast future price movements using historical market price data. JC helps us evaluate technical patterns across important markets and asset classes, and we are looking forward to sharing more of his research on our blog.
There is information everywhere.
WisdomTree has historically been focused on value, dividends and quality, so our research tends to comment on valuation discounts and fundamental trends across global markets.
We also recognize that momentum has been one of the strongest factors , according to academic literature, and that technical chart patterns (based on historical market price data) and fund flows carry a lot of information about the direction of the market.
The All Star Charts team, led by JC Parets, CMT, is looking at markets all over the world, priced in both local currency and U.S. dollars.
JC often uses gold as the denominator, as well as other indexes to analyze relative strength. It’s one giant web of money flow.
Can Technical Indicators Signal a Revival Overseas?
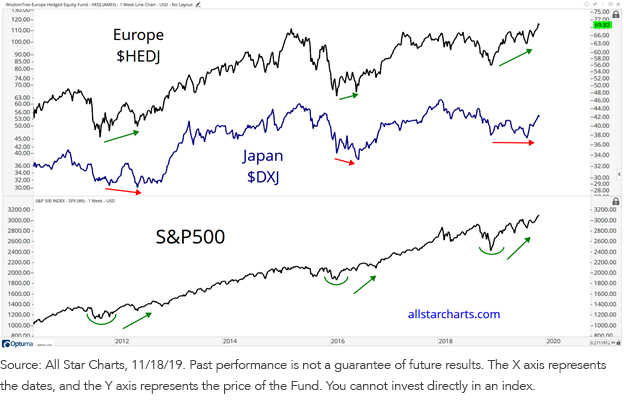
Recently, JC has focused on a divergence in global markets that has, in the past, coincided with important turning points.
Specifically, we at WisdomTree are looking at divergences in two WisdomTree currency-hedged exchange-traded funds for the European and Japanese equity markets: the WisdomTree Europe Hedged Equity Fund (HEDJ) and the WisdomTree Japan Hedged Equity Fund (DXJ), respectively.
These funds are designed to represent their markets priced in local currency terms as opposed to most other traditional, unhedged ETFs that typically have exposure to both:
- Foreign currency movements relative to the U.S. dollar
- Their local equity markets.
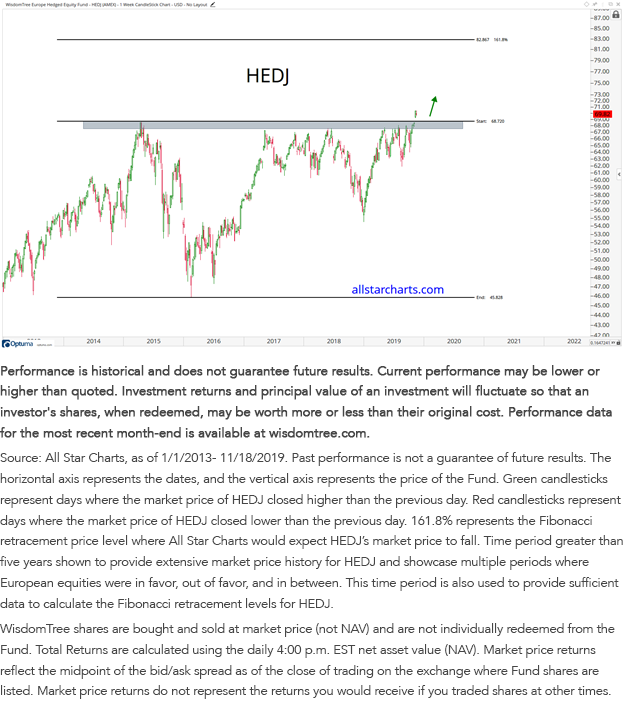
Figure 1 shows HEDJ breaking out to all-time highs recently.
As JC has noted, when was the last time you could say the words “Europe” and “all-time highs” in the same sentence with a straight face?
Figure 1: HEDJ Reaches All-Time High in Late 2019
For standardized performance of HEDJ, please click here.
While some analysts may assume that new peaks portend a major price reversal, JC comments that all-time highs ”are not characteristics of downtrends. New highs have historically preceded even higher highs.”
JC believes that HEDJ’s price may be able to continue even higher toward its 161.8% Fibonacci retracement levels near $83.
But What About Japan?
We don’t think Japan is too far behind.
Both Japan and Europe are sensitive to a bottoming in sentiment toward global trade fears and global growth dynamics.
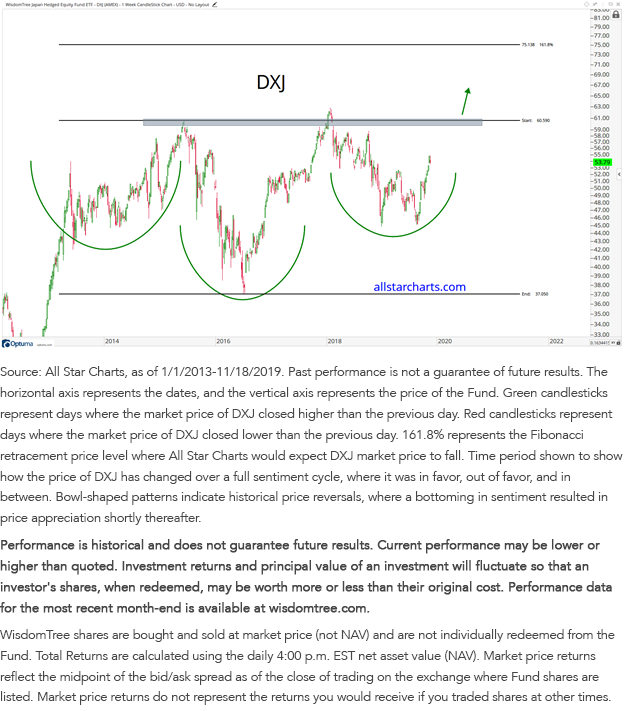
The chart in figure 2 certainly does not show as clean a breakout higher as in Europe, but JC believes the base and potential are both there.
Figure 2: DXJ Has Room to Run
For standardized performance of DXJ, please click here.
JC writes: “When Europe had a higher high and diverges positively versus Japan, the S&P 500 [Index] and stocks around the world start to rally. This just happened again.”
The Technicals Provide Optimism for Equities
The All-Star Charts team has been bullish on stocks because the overwhelming weight of technical evidence points to higher stock prices. They believe buying stocks has been and will continue to be more rewarding than selling them.
There is no holy grail of technical indicators, and the charts above do not pretend to be it. JC comments:
But when things like this keep adding up, pointing toward much higher stocks prices, it’s hard to ignore it, and it’s even harder to bet against it.
Think about it like this. If the people claiming the world is coming to an end are right, do you think European stocks would be breaking out to new highs? Heck no! They’d be right up front leading the global march to zero.
So when the gloom and doomers have their day, and their two weeks of fame, you’ll see it being priced into these charts above. Today, the money flow is suggesting the complete opposite.
The technicals could possibly point in favor of HEDJ if it is above $69.
Unless otherwise stated data source is All Star Charts as of November 15, 2019.
Important Risks Related to this Article
There are risks associated with investing, including the possible loss of principal. Foreign investing involves special risks, such as risk of loss from currency fluctuation or political or economic uncertainty. Investments in currency involve additional special risks, such as credit risk and interest rate fluctuations. Derivative investments can be volatile and these investments may be less liquid than other securities, and more sensitive to the effect of varied economic conditions. As these Funds can have a high concentration in some issuers, the Fund can be adversely impacted by changes affecting those issuers. Due to the investment strategy of these Funds they may make higher capital gain distributions than other ETFs. Please read each Funds’ prospectus for specific details regarding the Funds’ risk profiles.
This material contains the opinions of All Star Charts and/or its personnel, which are subject to change, and should not to be considered or interpreted as a recommendation to participate in any particular trading strategy, or deemed to be an offer or sale of any investment product, and it should not be relied on as such. There is no guarantee that any strategies discussed will work under all market conditions. This material represents an assessment of the market environment at a specific time and is not intended to be a forecast of future events or a guarantee of future results. This material should not be relied upon as research or investment advice regarding any security in particular. The user of this information assumes the entire risk of any use made of the information provided herein. WisdomTree does not endorse or recommend All Star Charts.
This material has been prepared without regard to the individual financial circumstances and objectives of any investor, and the appropriateness of a particular investment or strategy will depend on an investor’s individual circumstances and objectives. Investors and their advisors should consider the investors’ individual financial circumstances, investment time frame, risk tolerance level and investment goals. Investors should consult with their own advisors before engaging in any transaction.
Neither WisdomTree nor its affiliates, nor Foreside Fund Services, LLC, or its affiliates provide tax or legal advice. Investors seeking tax or legal advice should consult their tax or legal advisor. Unless expressly stated otherwise, the opinions, interpretations or findings expressed herein do not necessarily represent the views of WisdomTree or any of its affiliates.
Share & Comment
Popular Posts
Categories
Related Links
Jeremy Schwartz has served as our Global Chief Investment Officer since November 2021 and leads WisdomTree’s investment strategy team in the construction of WisdomTree’s equity Indexes, quantitative active strategies and multi-asset Model Portfolios. Jeremy joined WisdomTree in May 2005 as a Senior Analyst, adding Deputy Director of Research to his responsibilities in February 2007. He served as Director of Research from October 2008 to October 2018 and as Global Head of Research from November 2018 to November 2021. Before joining WisdomTree, he was a head research assistant for Professor Jeremy Siegel and, in 2022, became his co-author on the sixth edition of the book Stocks for the Long Run. Jeremy is also co-author of the Financial Analysts Journal paper “What Happened to the Original Stocks in the S&P 500?” He received his B.S. in economics from The Wharton School of the University of Pennsylvania and hosts the Wharton Business Radio program Behind the Markets on SiriusXM 132. Jeremy is a member of the CFA Society of Philadelphia.