
Share Buybacks: The Other Dividend


You have a business, and your cash on hand is growing. What do you do? If you park it in T-bills, the income generated will probably be negligible. You believe it’s time to move it off the balance sheet either as a dividend, which is often a taxable event, or by repurchasing shares, where taxes can be more easily managed (some shareholders will opt to sell, while others can sit tight).
Look at this writ large: Share buybacks have become the other dividend. According to Qing Li at S&P Dow Jones Indices, S&P 500 Index companies purchased $806 billion worth of shares last year (figure 1). For context, the total value of the S&P is $26 trillion.
Figure 1: S&P 500 Buyback Trends
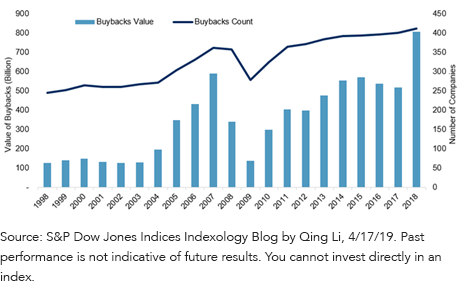
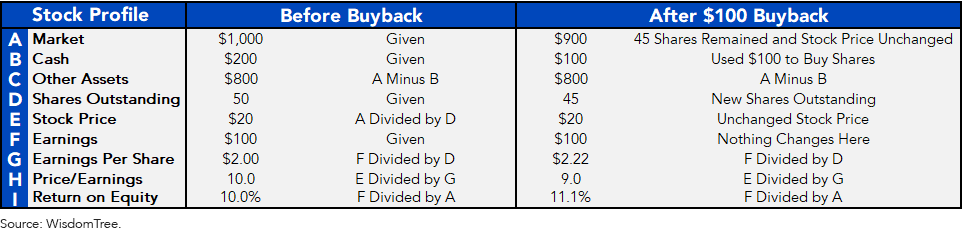
Figure 2 shows the logic using a hypothetical business worth $1,000 with $200 in cash. Say it only needs half the cash to operate. If management buys back stock, look what happens to earnings per share and return on equity (ROE). This isn’t rocket science, but on paper, the management looks like a bunch of geniuses.
Figure 2: Implementing a $100 Buyback
Some firms1 opt to do the opposite, issuing shares to raise money because they are growing or, troublingly, because business is down. At latest count, the S&P 500’s net buyback yield is 2.7%, found by netting out issuances from the volume of buybacks. Add the 1.9% dividend yield and the sum is the 4.6% shareholder yield.
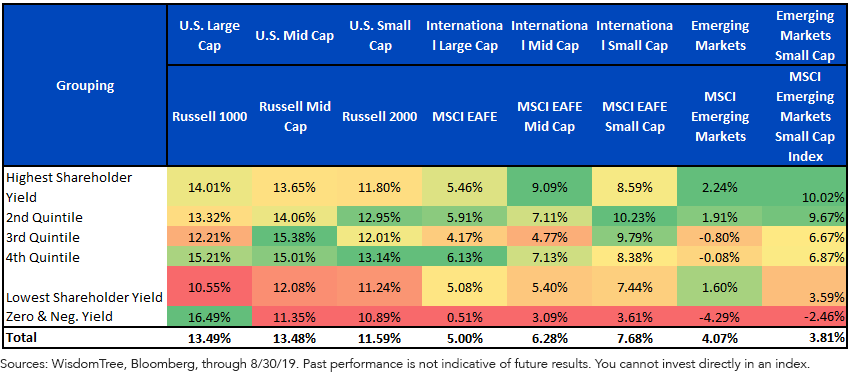
Figure 3 breaks out by shareholder yield the 10-year equity returns for the major asset classes. The groups generally show green on the top and red on the bottom. The lone exception is U.S. large caps, where net equity issuers and non-payers got the better of fundamental value seekers. Time will tell if this can last.
Figure 3: 10-Year Performance by Shareholder Yield Quintiles
Our ETF that targets heavy ownership of companies in the high quintiles is the WisdomTree U.S. Quality Shareholder Yield Fund (QSY). Judging by the location of the red ink in the table above, I’m heartened that we only have 1.5% of the ETF’s capital in the two "danger" quintiles.
Figure 4: Proportions of QSY in Each Quintile
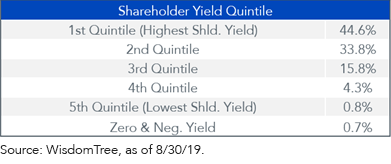
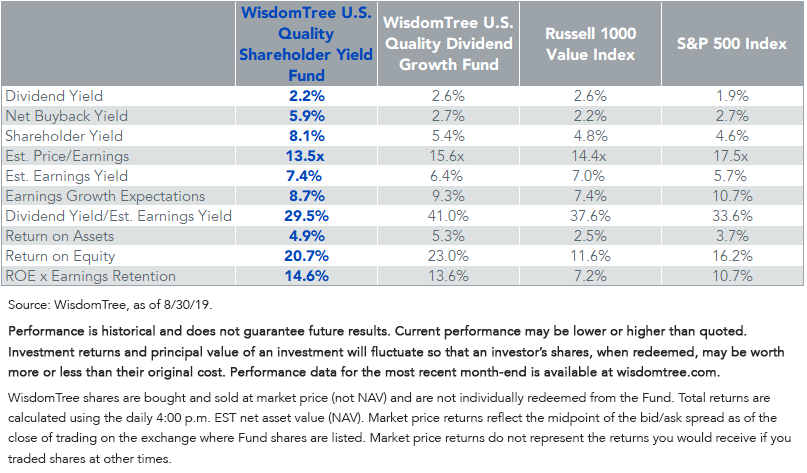
Figure 5 shows the fundamentals for QSY. I also added the WisdomTree U.S. Quality Dividend Growth ETF (DGRW) in the second column for the reader’s edification because it is one of our largest funds by assets under management, and it also has a shareholder yield that exceeds that of the broad market.
Figure 5: Fundamental Metrics
For standardized performance of the Funds mentioned in the chart, please click their respective tickers: QSY, DGRW.
For definitions of terms in the chart, please visit our glossary.
Unless otherwise stated, all data from Bloomberg, as of 9/12/19.
1Source: WisdomTree, as of 8/30/19.
Important Risks Related to this Article
There are risks associated with investing, including possible loss of principal. Funds focusing their investments on certain sectors increase their vulnerability to any single economic or regulatory development. This may result in greater share price volatility. While QSY is actively managed, the Fund’s investment process is expected to be heavily dependent on quantitative models, and the models may not perform as intended. Please read each Fund’s prospectus for specific details regarding the Fund’s risk profile.
Share & Comment
Popular Posts
Categories
Related Links