Reassessing U.S. Valuations


As investors approached the start of the new year, there were few reasons for optimism. The fourth quarter of 2018 was the worst quarter for U.S. equities in seven years,1 and it seemed as though the Federal Reserve was steadfast on further monetary tightening in 2019, despite the market slide.
It felt like the nearly decade-long rally was over, and the punch bowl was being taken away.
But lo and behold, the bulls would be proven correct! The S&P 500 Index experienced its best first quarter in two decades. After double-digit gains at the start of the year, where do U.S. equity valuations stand now?
Trailing Price-to-Earnings (P/E): 9% Multiple Expansion
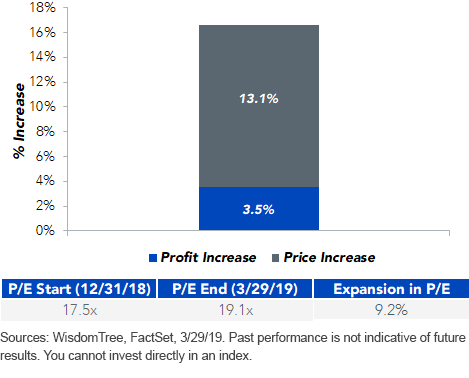
U.S. corporate earnings growth had a blockbuster year in 2018. S&P 500 Index earnings grew by 20% on a year-over-year basis.2 These strong earnings, coupled with the negative returns on the year, left U.S. equities at lower earnings multiples.
The chart below shows the price increase of the S&P 500 Index through Q1 2019 and the percent increase in trailing 12-month earnings for the index. With the S&P 500 up 13% and earnings up just 3.5%, the trailing 12-month P/E multiple expanded from 17.5x to start the year to 19.1x by the end of the quarter.
The multiple of 19.1x earnings ranks in the 66th percentile of expensiveness, going back to 2002,3 meaning valuations are currently above the median but not overly rich compared to historical levels.
S&P 500 Multiple Expansion Attribution

Price-to-Free Cash Flow (P/FCF): Modestly Priced
A complete picture of valuations requires a look at more than one metric.
According to Bank of America Merrill Lynch, free cash flow multiples have historically been the best valuation metric at the end of a cycle.4 This makes sense, as investors may value the certainty of present cash flows over more subjective earnings.
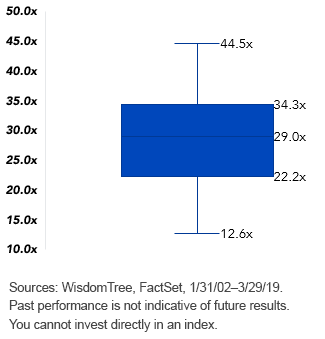
The S&P 500 Index’s P/FCF multiple of 29.2x is near the historical median of 29.0x, going back to 2002.
We have written about profitability and cash flow risks in broad, small-cap U.S. equities. But cash flow-based valuations of large-cap U.S. equities do not generate as much concern. Among large-cap U.S. equities, free cash flow valuations are rather benign.
S&P 500 Index: Price-to-Free Cash Flow

Isolating Free Cash Flows
There are also ways to tap into more attractive free cash flow yields in a systematic fashion that investors may want to focus in on for late-cycle positioning.
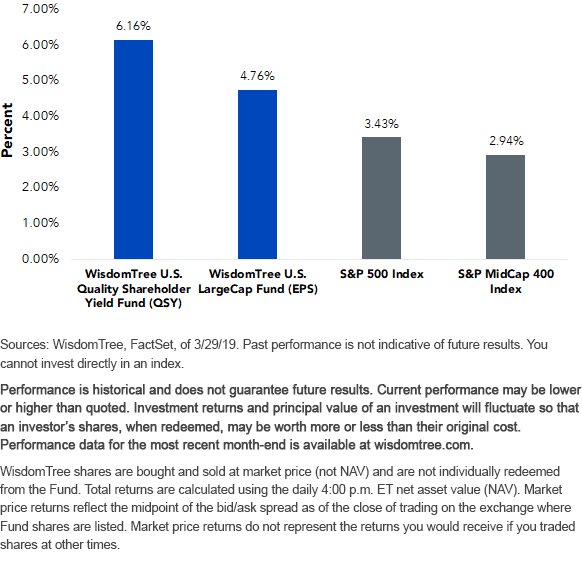
In WisdomTree’s toolkit of domestic equity exposures, Funds that focus on earnings and free cash flow have been useful at finding attractive valuation opportunities. The chart below shows that the WisdomTree U.S. Quality Shareholder Yield Fund (QSY) and the WisdomTree U.S. LargeCap Fund (EPS) provide attractive cash flow valuations compared to the S&P 500 Index and the S&P MidCap 400 Index.
EPS seeks to provide a broad-based exposure to the 500 largest profitable U.S. equities. QSY is a more selective cut of large- and mid-cap companies specifically targeting higher shareholder yields (dividend yield + net buyback yield) with quality attributes, like higher free cash flow.
Free Cash Flow Yield

Please click each Fund’s ticker for standardized performance: QSY, EPS.
1Sources: WisdomTree, Zephyr StyleAdvisor. Based on quarterly returns of the S&P 500 Index.
2John Butters, “Earnings Insight,” FactSet, 3/29/19, p. 16.
3Data, 1/31/02–3/29/19.
4Source: Bank of America Merrill Lynch, “Quantitative Profiles: Quality led in 2018: favor Quality, Large Cap and FCF in 2019,” 1/11/19.
Important Risks Related to this Article
There are risks associated with investing, including possible loss of principal. Funds focusing their investments on certain sectors increase their vulnerability to any single economic or regulatory development. This may result in greater share price volatility. While QSY is actively managed, the Fund’s investment process is expected to be heavily dependent on quantitative models and the models may not perform as intended. Please read each Funds’ prospectus for specific details regarding the Funds’ risk profile.
Double-digit returns were achieved primarily during favorable market conditions. Investors should not expect that such favorable returns can be consistently achieved. Performance, especially for very short time periods, should not be the sole factor in making your investment decision.


