Boosting Efficiency with Levered 60/40


When most people think about leverage, they think about it through the lens of added risk. While that’s one view, leverage can also be an effective means of preserving a higher Sharpe ratio in a portfolio while seeking higher absolute returns. In our view, leverage can be a powerful tool for boosting the efficiency of portfolios, even during potentially volatile markets.
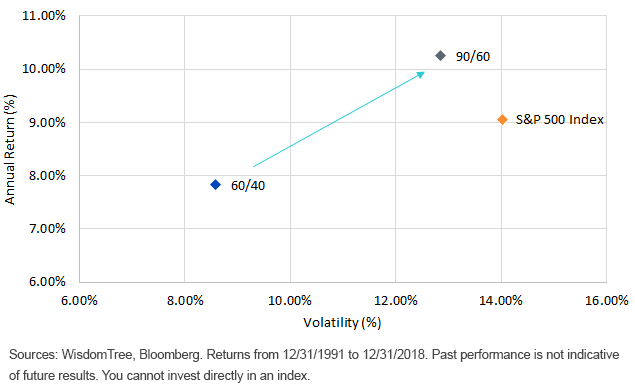
Take the standard 60% equity/40% bond portfolio (60/40)1, for instance. Historically, the 60/40 portfolio has produced a higher Sharpe ratio than that of 100% equities (0.62 vs. 0.50).2 If investors were to lever a 60/40 portfolio by 1.5, the resulting 90/60 portfolio3 could potentially achieve equity-like returns while maintaining the diversification benefit of the bond allocation. Figure 1 below shows this exact story. Looking at this analysis back to 1991, a 90/60 portfolio funded by 1–3 Month Treasury Bills produced a higher return and had lower volatility than the S&P 500 Index.
Figure 1: Levering a Higher Sharpe Portfolio

The WisdomTree 90/60 U.S. Balanced Fund (NTSX) seeks to apply 1.5x accounting leverage to a traditional 60/40 portfolio to create exposure equal to 90% equities, 60% bonds. This exposure is created by investing 90% of Fund assets in equities and 10% in short-term fixed income. The 60% bond exposure is achieved by overlaying Treasury futures contracts to achieve the net 90/60 target. Interestingly, in its limited history, NTSX was able to protect against an equity downdraft while keeping up with a market rally.
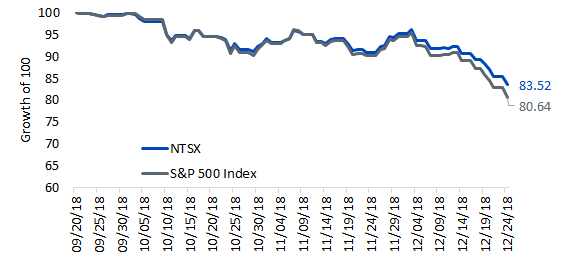
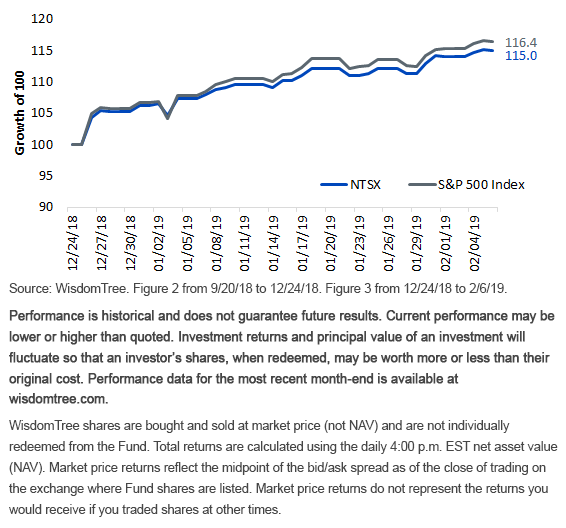
While many investors understand the strategy conceptually, looking at live returns provides some extremely instructive use cases. The most recent equities drawdown, which was followed by a post-Christmas rally, is a clear example of this. When equities, as proxied by the S&P 500 Index, fell by 19% in late 2018, NTSX fell by only 16% due in large part to the bond exposure in the Fund (figure 2). When equities rallied after Christmas, NTSX kept up in performance. NTSX returned 15%, keeping up with SPY (16.4%) from 12/24/18 to 2/6/19 (figure 3).
Figure 2: Peak to Trough in the Latest Correction in 2018

Figure 3: Post-Christmas Rally (12/24/18–2/6/19)

For standardized performance of NTSX, please click here.
In our view, NTSX provides investors with the potential to boost returns while achieving better overall portfolio diversification. Despite an increase in volatility, we believe this approach provides investors with a powerful tool to enhance their asset allocation and free up capital for other, less correlated investments.
160%/40% represented by monthly blend of 60% to the S&P 500 Index and 40% to the Bloomberg Barclays U.S. Aggregate Index.
2Sharpe ratio evaluated by looking at risk-adjusted returns of a 60/40 portfolio from 12/31/1991 to 12/31/2018.
3A 90% equity/60% bond portfolio takes a 60/40 monthly rebalanced portfolio levered 1.5 times, funded with 50% cost to 1–3 Month Treasury Bills as proxied by the Bloomberg Barclays U.S. 1-3 Month Treasury Bill Index.
Important Risks Related to this Article
There are risks associated with investing, including possible loss of principal. While the Fund is actively managed, the Fund’s investment process is expected to be heavily dependent on quantitative models and the models may not perform as intended. Equity securities, such as common stocks, are subject to market, economic and business risks that may cause their prices to fluctuate. The Fund invests in derivatives to gain exposure to U.S. Treasuries. The return on a derivative instrument may not correlate with the return of its underlying reference asset. The Fund’s use of derivatives will give rise to leverage, and derivatives can be volatile and may be less liquid than other securities. As a result, the value of an investment in the Fund may change quickly and without warning, and you may lose money. Interest rate risk is the risk that fixed income securities, and financial instruments related to fixed income securities, will decline in value because of an increase in interest rates and changes to other factors, such as the perception of an issuer’s creditworthiness. Please read the Fund’s prospectus for specific details regarding the Fund’s risk profile.


