U.S. Econ Watch: Searching for Clues


After at least a month-long delay, fixed income investors have finally been receiving economic data. With a number of government agencies closed due to the recent shutdown, 2019 began with a data vacuum, but now it looks like we are making up for lost time. Unfortunately, these “data delays” render some of the economic information potentially old or stale. Nevertheless, the data still offers insights as to how 2018 ended and can provide clues on any possible springboard effects for the current year.
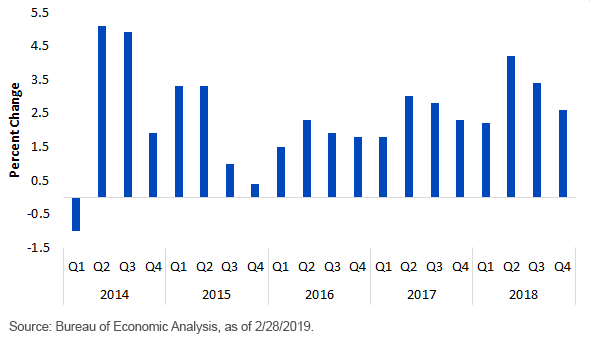
A perfect case in point is last week’s release of the Q4 2018 real GDP report. Yes, the data is two to three months old, but the underlying components in this release can offer insights for the future. First, let’s go high level and look at some headline numbers. For Q4, the Bureau of Economic Analysis’ (BEA) initial estimate for growth was pegged at +2.6%. While this was a drop-off from the Q3 pace of +3.4%, it beats consensus forecasts by nearly half a percent. For 2018 as a whole, real GDP came in at +2.9%. This rate of expansion has been reached only two other times since 2005. On a Q4/Q4 basis, growth was pegged at +3.1%, finally eclipsing the elusive 3% threshold.
U.S. Real GDP

While recession fears have been a part of the economic dialogue, the ongoing debate seems to be more centered on what type of slowdown we should expect in 2019. The accompanying graph illustrates that growth has trailed off a bit after reaching its most recent high-water mark of +4.2% in Q2. Some further deceleration is likely. In fact, Q1 2019 real GDP will likely be held down by the aforementioned shutdown, but then snap back in Q2 as those negative effects are reversed. Overall, real GDP in the area of +2¼% is my base case for this year.
Let’s take a look at the GDP engine cylinders:
Personal consumption expenditure (PCE): Household spending rose at a +2.8% annual clip in Q4, which translated to a 1.9 percentage point (pp) contribution to growth. This component should continue to be a positive force for the economy this year.
Gross private domestic investment: This category consists of two main sub-groupings, business and residential, which combined added 0.8 pp to the GDP. Business spending was on the plus side of the ledger, but housing came in negative. This cylinder will be difficult to gauge going forward, as higher mortgage rates could tilt it into the minus column.
Net exports (trade): There’s no surprise here, as trade remained a drag on growth in Q4. While some uncertainty could get removed with a U.S./China deal, the lasting effects of the dollar’s strength in 2018 may continue to act as a drag on future growth.
Inventories: Always a wild card of sorts, inventories actually put forth a positive contribution to GDP in Q4. If demand (household spending) doesn’t keep pace, this cylinder could switch course and be a negative force early in 2019.
Government spending: This category hit a positive note for the fifth consecutive quarter—albeit by a rather modest margin—and I would expect, on balance, further plus contributions going forward.
Conclusion
What does it all mean? From the Fed’s perspective: a patient business, as usual. For the U.S. Treasury market: The 10-year yield has bounced up a little—more than 10 basis points (bps) since around Presidents’ Day—and looks to be locked in a 2.55%–3.05% trading range on a shorter-term basis.
Unless otherwise noted, all data is from Data is Bureau of Economic Analysis, as of February 28, 2019.
Learn more in our new podcast series Basis Points with Kevin Flanagan.


