A Better Way to Structure an ETF Portfolio


Recently, we showed how WisdomTree’s new ETF Characteristics Comparison Tool can contrast the fundamentals of WisdomTree funds with market benchmarks over time.
After an uptick in volatility, some investors may be eager to find ways to manage valuations in today’s market. Below we show how investors can use our new tool to help focus on fundamentals in 2019.
Higher Valuations Are Not the Answer
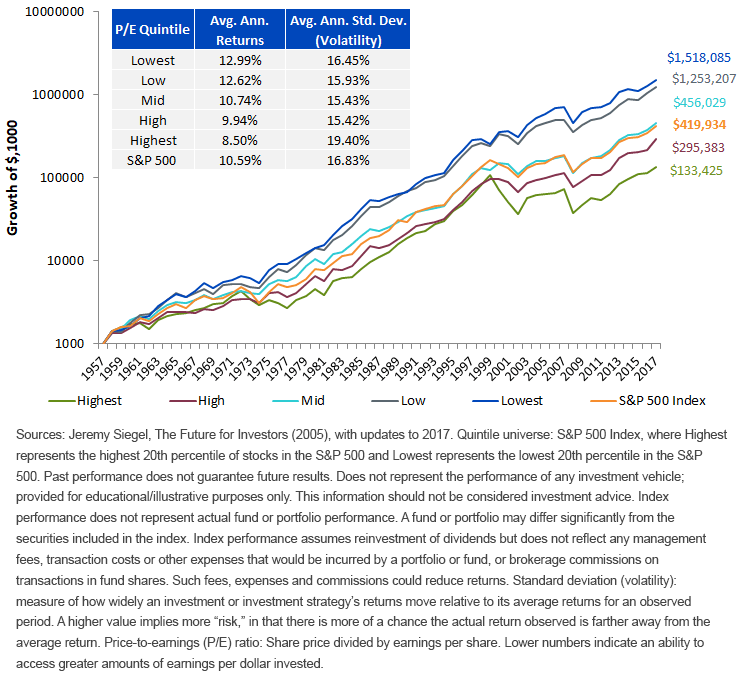
While valuations alone should never be an investing catalyst, economic research has shown that returns tend to be higher at lower price-to-earnings (P/E) ratios (and higher earnings yields). Professor Jeremy Siegel highlighted this point in his book, The Future for Investors, showing that stocks with lower P/E ratios outperformed those with higher P/E ratios over long periods of time, and with lower volatility.
Figure 1: Cumulative Growth of $1,000 Based on Relative P/E Quintiles, 12/31/1957–12/31/2017

Given that overvaluation poses one of the greatest risks during market bubble peaks—when investors drive stock prices far beyond their intrinsic value—our research has shown that investors can mitigate risk by managing valuations by anchoring to fundamentals.
WisdomTree created a suite of indexes (and ETFs designed to track such indexes) over a decade ago to address inherent flaws in market-capitalization weighting that can concentrate investors in high-valuation stocks. Our earnings-focused indexes only invest in companies with positive core earnings over the trailing 12 months. In order to magnify the impact of earnings in the methodology, companies are then weighted by their individual contribution to the Earnings Stream. As a result, companies generating the largest dollar value in earnings will receive the largest weight in the portfolio.
The Right Tools for the Job
The WisdomTree U.S. Earnings 500 Fund (EPS), which seeks to track the WisdomTree U.S. Earnings 500 Index (WTEPS), is an example of a fundamentally weighted strategy. EPS weights the 500 largest U.S. companies proportionately by the share of the aggregate earnings each component company has generated, rather than benchmarks such as the S&P 500 Index, which relies on market cap to determine weights in the index.
Using our ETF Characteristics Comparison Tool, we can see how the valuation story has played out vs. the S&P 500 Index over the course of EPS’s history.
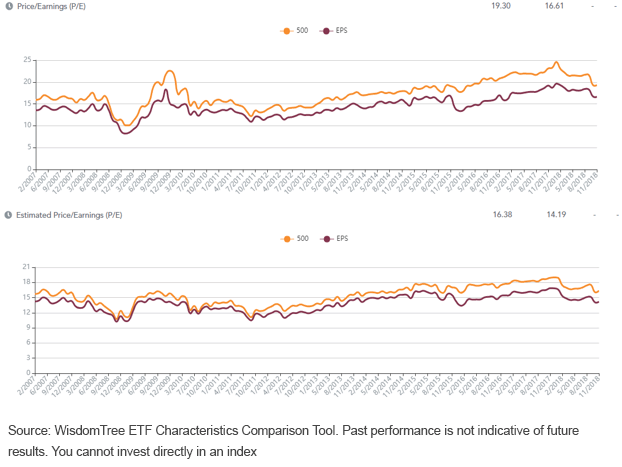
Figure 2 shows EPS has been trading at a considerable valuation discount to the S&P 500 on both a trailing and forward P/E basis. This makes intuitive sense since EPS increases exposure to more profitable companies among large-cap U.S. equities. In fact, since inception, EPS has tended to trade at a 18.3% average discount to the S&P 500 on a trailing basis, and a 12.1% average discount on a forward basis.
Figure 2: Historical Trailing and Forward P/Es of EPS vs. S&P 500, 2/28/07–11/30/18

For standardized performance of EPS, please click here.
Tilting Toward Quality
In addition to managing valuations, another aspect on many investors’ radars is the notion of “quality.”
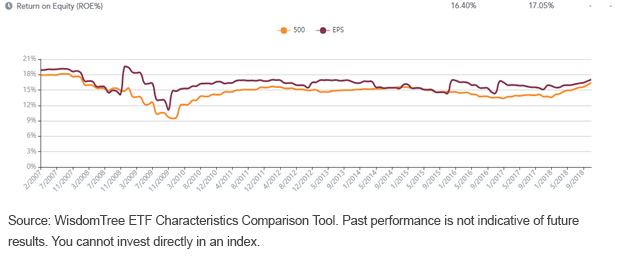
As we have written several times, quality companies tend to perform well during the later stages of a bull market. By using fundamental metrics such as return on equity (ROE) as a proxy for quality, EPS has compared favorably to the S&P 500 in this respect as well.
Notably, the ROE gap between EPS and the S&P 500 became more pronounced during periods of distress, such as the global financial crisis from 2008 to 2009.
Figure 3: Historical ROE of EPS vs. S&P 500, 2/28/07–11/30/18

Conclusion
These characteristics help illustrate the difference a Modern AlphaTM approach can make for portfolio construction. We continue to build out our capabilities to empower investors with new tools and information. We encourage investors to continue to use this tool and take a closer look at the underlying risks in their current asset allocation.
Check out all WisdomTree investing tools here.
Unless otherwise stated, data is sourced by WisdomTree, as of 11/30/18.
Important Risks Related to this Article
There are risks associated with investing, including possible loss of principal. Funds focusing their investments on certain sectors increase their vulnerability to any single economic or regulatory development. This may result in greater share price volatility. Please read the Fund’s prospectus for specific details regarding the Fund’s risk profile.


