Distilling WisdomTree’s U.S. Multifactor Performance


Since we launched the WisdomTree U.S. Multifactor Index (WTUSMF) just over 14 months ago, the strong relative performance of this Index has led to questions regarding what is driving it. The S&P 500 Index often acts as a barometer for core large-cap U.S. equity performance, which explains why investors may choose to benchmark to this index, and contributes to why we use it for comparison on our Index attribution page. Relative to the S&P 500, since inception, WTUSMF has outperformed by 327 basis points (bps) on an absolute basis and with lower volatility. But the S&P 500 is not the only logical benchmark, and understanding why can help distill some critical elements of the Index’s methodology.
Benchmarking: Why Look at the S&P 500 Equal Weight Index?
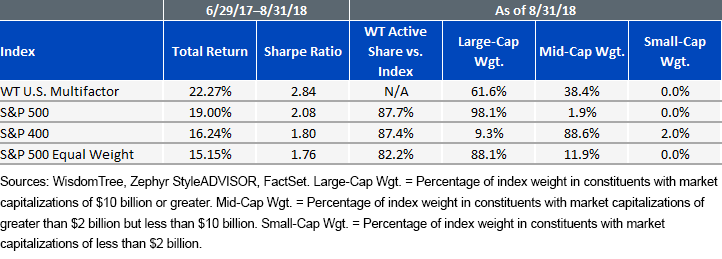
In the table below, we show the active share and the market-cap distribution of WTUSMF relative to three indexes that we are most often asked to compare with this strategy. The S&P 400 Index, a broad benchmark of performance for mid-cap U.S. equities, merits comparison given WTUSMF’s sizable allocation to this portion of the market—nearly 40% as of August 31, 2018. WTUSMF has sizably outperformed the S&P 400 on both an absolute and a risk-adjusted basis.
However, our preferred benchmark is the S&P 500 Equal Weight Index because of WTUSMF’s weighting mechanism, which results in more of an equal-weight than a market cap-weighted Index. Both indexes have most of their weight in large caps but with material exposure to mid-caps, providing a size tilt compared with the S&P 500. WTUSMF has the lowest active share relative to this benchmark, indicating this is the Index with which it has the greatest overlap, and, since inception, it has outperformed this benchmark by over 700 bps.
Index Comparison, since WTUSMF Inception

Under the Hood of WTUSMF
To understand why we say this Index is more equally weighted, we need to start with how we arrive at our constituents and weighting. WTUSMF scores the 800 largest U.S. companies based on their exposure to value, quality, momentum and low-correlation factors and then selects the top 200 by their combined multifactor score. By starting with a universe of 800, the selection process can include more mid-cap companies than if it used just the top 500 by market cap alone. WTUSMF also uses this multifactor score as part of the weighting mechanism, which is complemented by a low-volatility component.
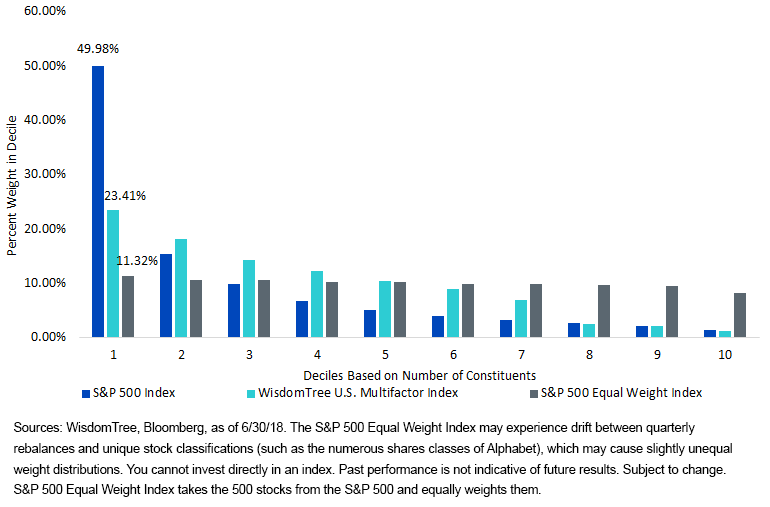
Given the ordinal nature of the scoring and weighting process, WTUSMF’s final weights tend to feel closer to an equal-weighted portfolio rather than a market cap-weighted one. In the chart below, we illustrate the weights of WTUSMF, the S&P 500 and the S&P 500 Equal Weight by deciles. WTUSMF has significantly less weight allocated to its top 10%, or largest 20 constituents, than the S&P 500 Index, and its weighting distribution is closer to the equal-weighting distribution.
Percent of Total Weight in Each Decile

Equal Weighting Underperforming
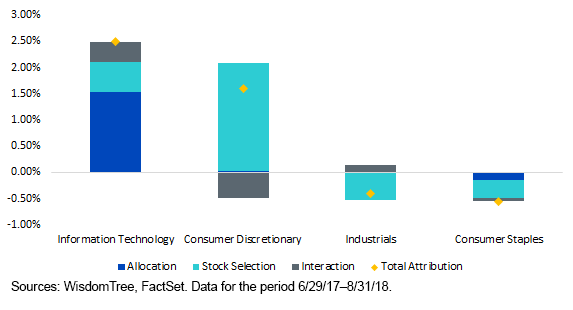
Over the last 14 months, the S&P 500 Index has outperformed its equal-weighted counterpart by almost 400 bps, with the Information Technology and Consumer Discretionary sectors being the main contributors while Industrials and Consumer Staples were the main detractors. Market cap-weighted indexes, such as the S&P 500 Index, are over-weight in the largest sectors and companies in the investment universe. During this time frame, the largest sectors and companies exhibited strong returns, which in turn explains why the S&P 500 Index outperformed the S&P 500 Equal Weight Index.
As can be seen in the chart below, the Information Technology sector, which has the largest weight in the S&P 500 Index, also had the best performance across sectors, deriving an important portion of its alpha from the allocation effect. Consumer Discretionary companies with large market caps outperformed smaller companies in the sector, thus resulting in a strong stock selection effect because these larger companies received greater weight in the cap-weighted index. On the other hand, smaller Industrials and Consumer Staples companies outperformed larger ones, explaining most of the performance drag from these sectors and shown as negative stock selection below.
Sector Performance Attribution

In a period where the largest sectors and companies led in performance, WTUSMF’s stock selection and factor diversification allowed it to outperform both the equal-weighted and market cap-weighted versions of the S&P 500. This indicates to us that simply deviating from market cap weighting is not enough: stock selection and factor diversification are critical.
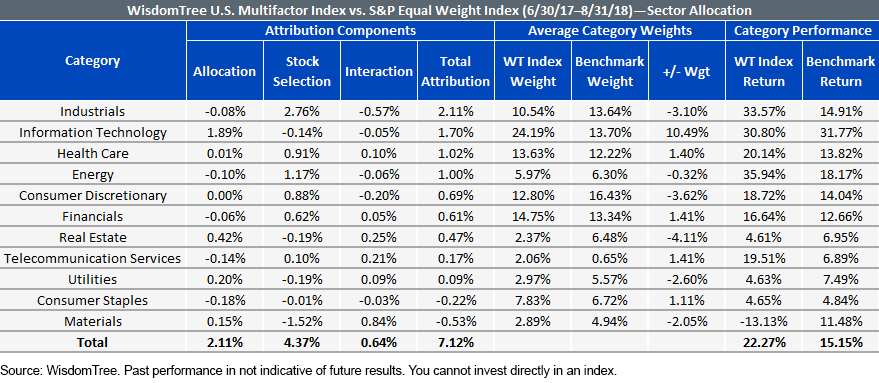
Attribution vs. S&P 500 Equal Weight
At its core, the goal of constructing the WisdomTree Index was to outperform based on stock selection rather than sector allocation. Another interesting consideration for the Index’s methodology to achieve this goal is its sector neutrality to the starting universe of the largest 800 U.S. companies by market cap. As a result, relative to the S&P 500 sector, active weights are close to 0%.
Sector weights relative to the S&P 500 Equal Weight Index, on the other hand, will have larger tilts because these are dependent on the number of constituents in a given sector rather than their market cap. Resulting sector tilts contributed 211 bps to WTUSMF’s outperformance, but the greater portion of alpha is still coming from stock selection. Comparing the WisdomTree Index against an equal-weighted benchmark allows for a better sector-by-sector stock selection analysis.
The S&P 500 indexes hold, on average, 69 companies from the Industrial sector, and the equal-weighted portfolio of these companies returned close to 15% annually over the last 14 months. Meanwhile, WTUSMF, through its composite multifactor methodology, selected 14 companies that outperformed by 20%, a contribution of 2.76% to total alpha. Similarly, the 32 constituents of the Energy sector provided an equal-weighted annual return of 18%, while a more concentrated basket of seven constituents selected by WTUSMF doubled that performance. This gets back to the decision to select 200 stocks for the Index: broad enough to include a diverse basket but concentrated enough to be differentiated and to outperform the benchmark.

Conclusion
Comparing an index to different benchmarks can shed light on how different characteristics work. In this case, comparing WTUSMF to a broad, equal-weighted portfolio such as the S&P Equal Weight Index shows us that our composite multifactor approach has worked when selecting stocks across sectors, and alpha isn’t a result of a simple size or sector tilt.
Unless otherwise noted, returns are for the period June 29, 2017, through August 29, 2018, and are sourced from WisdomTree, Zephyr StyleADVISOR and FactSet.

Alejandro Saltiel joined WisdomTree in May 2017 as part of the Quantitative Research team. Alejandro oversees the firm’s Equity indexes and actively managed ETFs. He is also involved in the design and analysis of new and existing strategies. Alejandro leads the quantitative analysis efforts across equities and alternatives and contributes to the firm’s website tools and model portfolio infrastructure. Prior to joining WisdomTree, Alejandro worked at HSBC Asset Management’s Mexico City office as Portfolio Manager for multi-asset mutual funds. Alejandro received his Master’s in Financial Engineering degree from Columbia University in 2017 and a Bachelor’s in Engineering degree from the Instituto Tecnológico Autónomo de México (ITAM) in 2010. He is a holder of the Chartered Financial Analyst designation.


