Use Cases for the WisdomTree 90/60 U.S. Balanced Fund


In rural Maine at Camp Kotok, I sat with Barry Ritholtz, CIO of Ritholtz Wealth Management, on the deck of Leen’s Lodge discussing the launch of the WisdomTree 90/60 U.S. Balanced Fund (NTSX) and how investors should think about using this new 90/60 strategy in a portfolio context.
My starting point was very technical and specific for how a 90/60 portfolio combination could be useful: a two-thirds allocation to a 90/60 strategy represents a common 60/40 portfolio of stocks/bonds and this “capital-efficient” access vehicle would free the remaining one-third of additional capital to be deployed in other diversifying strategies or simply just additional exposure.
Ritholtz stopped me halfway through my explanation and suggested I was positioning this 90/60 strategy all wrong. He asked (or perhaps suggested): “Wouldn’t you be better off positioning this 90/60 strategy as a ‘hedged equities’ strategy, with the bond exposure acting as a ‘hedge,’ or diversifier, to U.S. equity exposure?”
Do Bond Futures Act as a Hedge to Equities?
While there are of course no guarantees in life—in particular, that future returns in either stocks or bonds, or the relationship between stocks and bonds, will hold in the future as they have in the past—evaluating the last 30 years of bond futures index data can give us an idea for how bond futures may perform during declining equity markets.
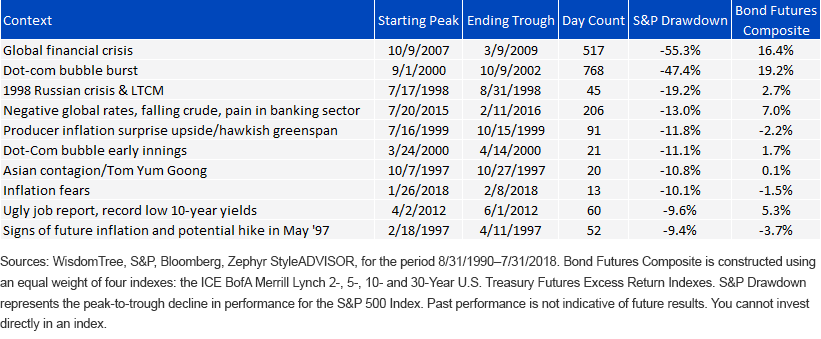
We evaluated the last 10 big market drawdowns over the last three decades—the limit of historical lookback being bond futures index data.

The two biggest equity declines—the global financial crisis and the bursting of the dot-com bubble that saw approximately 50% drawdowns in equities—coincided with positive returns to bond futures indexes, as investors flocked out of risky assets to bonds, sending bond yields down and bond futures index returns up. The gains in bond futures indexes were over 15% in each period—meaning that the gains in bonds would have cushioned some of the declines (a modest amount), lending to a partial hedge to equity exposure with the bond futures.
Of course, bond futures didn’t act as a hedge in every market decline, but the probability of it being in your favor was in your favor. The gains in bond futures provided you the most cushioning during the two aforementioned drawdowns. In seven of these 10 declining equity markets, the bond futures indexes provided a positive return, and in three of 10 equity declines coincided with negative bond futures returns.
One period in which bonds declined alongside equities was from July 1999 to October 1999, when the S&P 500 Index had an 11.8% drawdown that coincided with positive inflation surprises, rising interest rates and investors believing then Federal Reserve Chairman Alan Greenspan was becoming more hawkish.
More recently, in January/February 2018, inflation data started giving fears of rising interest rates and a more aggressive Federal Reserve, as the 10-Year rates picked up and the S&P 500 had about a 10% correction—with bond futures declining approximately 1.5% over a two-week stretch when the S&P 500 lost 10.1%.
90/60 Strategy to Lower Equity Beta:
If one compares a 90/60 strategy with a 100% equities position, the lower exposure to equities (10% lower exposure by only investing 90 cents of every dollar invested into equities) is one way this 90/60 strategy acts as a lower beta/lower volatility approach—that is, by being “less invested.”
The key question is: can the 10% cash exposure plus the 60% bond futures exposure help achieve similar returns as the 100% equities but with lower volatility?
To determine if the strategy will have lower volatility, one important relationship to examine will be the correlation between stocks and bond futures. If stocks and bonds decline at the same time (i.e., a rising interest rate environment causes stocks to decline), there could be compounding risk. But the lower equity exposure (being only 90% invested in equities for every dollar investor) could ultimately dampen volatility enough to keep volatility lower with a 90/60 strategy.
Our research does lead us to believe the combined volatility in a 90/60 strategy should be lower than 100% equities, and, if anything, recent evidence shows increasing diversification of the stock and bond pieces.
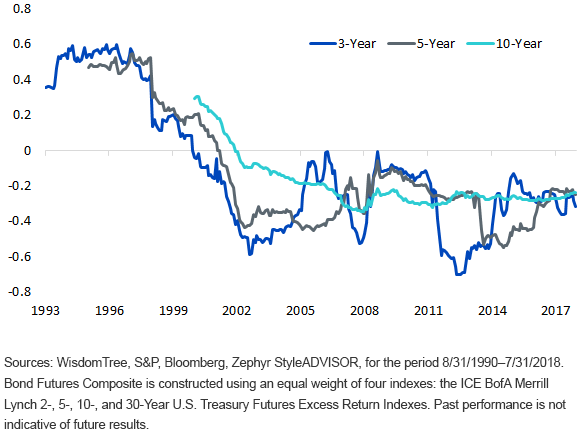
Using trailing 3-/5-/10-year correlation windows shows a trend toward consistently negative correlations of stocks and bond futures. There was a time over last 30 years during the early 1990s where there was a more positive correlation, but that hasn’t been the case recently. Bonds have increasingly acted as a “negative beta” asset to equities and have shown negative correlation and diversification potential.
Rolling Correlations of S&P 500 and Bond Futures Composite

- Our expectation is that less than 20% of rolling three-year periods will wind up with the 90/60 strategy having a beta greater than 1 to equities, while more than 66% of rolling three-year periods should exhibit an equity beta lower than .9.
While certainly one use case for the 90/60 strategy is to supplement a traditional stock and bond portfolio, I think Ritholtz made a very good point in Maine—perhaps this 90/60 strategy will also find some additional use cases in helping investors lower their equity market risk while trying to achieve similar long-term returns as a 100% equities position.
Important Risks Related to this Article
There are risks associated with investing, including possible loss of principal. While the Fund is actively managed, the Fund’s investment process is expected to be heavily dependent on quantitative models and the models may not perform as intended. Equity securities, such as common stocks, are subject to market, economic and business risks that may cause their prices to fluctuate. The Fund invests in derivatives to gain exposure to U.S. Treasuries. The return on a derivative instrument may not correlate with the return of its underlying reference asset. The Fund’s use of derivatives will give rise to leverage and derivatives can be volatile and may be less liquid than other securities. As a result, the value of an investment in the Fund may change quickly and without warning and you may lose money. Interest rate risk is the risk that fixed income securities, and financial instruments related to fixed income securities, will decline in value because of an increase in interest rates and changes to other factors, such as perception of an issuer’s creditworthiness. Please read the Fund’s prospectus for specific details regarding the Fund’s risk profile.
Diversification does not eliminate the risk of experiencing investment losses.

Jeremy Schwartz has served as our Global Chief Investment Officer since November 2021 and leads WisdomTree’s investment strategy team in the construction of WisdomTree’s equity Indexes, quantitative active strategies and multi-asset Model Portfolios. Jeremy joined WisdomTree in May 2005 as a Senior Analyst, adding Deputy Director of Research to his responsibilities in February 2007. He served as Director of Research from October 2008 to October 2018 and as Global Head of Research from November 2018 to November 2021. Before joining WisdomTree, he was a head research assistant for Professor Jeremy Siegel and, in 2022, became his co-author on the sixth edition of the book Stocks for the Long Run. Jeremy is also co-author of the Financial Analysts Journal paper “What Happened to the Original Stocks in the S&P 500?” He received his B.S. in economics from The Wharton School of the University of Pennsylvania and hosts the Wharton Business Radio program Behind the Markets on SiriusXM 132. Jeremy is a member of the CFA Society of Philadelphia.

