How Much Does Your Portfolio Rely on Technology?


With Apple finally having eclipsed the $1 trillion market cap threshold, and other companies also knocking at that door, an increasingly discussed topic among investors has been whether the narrowing of the recent rally to a handful of tech names is signaling the time to pare back exposure to the sector altogether.
At WisdomTree, we recognize that history tends to repeat itself and investors must learn from past bubbles, such as the dot-com bubble, to steer clear of future ones. This is why we launched our fundamentally weighted Indexes: to ensure that fundamentals, and not merely investor sentiment, drive index exposures.
Many of today’s large tech companies are rewarding shareholders in the form of massive dividend and share buyback programs, earning their way into fundamentally weighted indexes. However, as has been highlighted by some of the tech-driven sell-offs of 2018, these companies are a disparate group, with vastly different fundamental and technical characteristics. A comparison of the WisdomTree U.S. Quality Dividend Growth Index and the S&P 500 Index helps illustrate the relative tech exposures and fundamentals that result from imposing a quality screen and dividend-weighting on large-cap U.S. equities.
FAANG Factor Tilts—Apple on Top
Since its inception, the WisdomTree Index has been near market weight in the Information Technology sector and over-weight in the Consumer Discretionary sector, despite never owning the FAANG (Facebook, Apple, Amazon, Netflix, Google) stocks that have never paid a dividend (Apple began its dividend payout in 2012).
In the table below, we analyze the factor exposures of the FAANGs (12% of the S&P 500) through the lens of WisdomTree’s fundamental and technical factor scores. This same process is used to construct the WisdomTree U.S. Multifactor Index. What this factor quilt aims to show is that despite their common grouping, these companies are drastically different in terms of their factor exposures. The scoring works on a scale of 0% as the worst possible score to 100% as the best.
Multifactor Scores

- Technical Measures
- Volatility: Using trailing 12-month volatility, Apple and Alphabet (Google’s parent company) have the highest scores, interpreted as being the least volatile. In contrast, Netflix has the worst score by a wide margin, and Amazon and Facebook are clustered together near the cutoff of the bottom third of volatility scores.
- Momentum: Our momentum measure uses trailing 6- and 12-month risk-adjusted returns, granting high marks to Netflix and Amazon. Apple and Alphabet are in the middle of the pack, and Facebook is again in the bottom third of companies by this technical indicator.
- Correlation: This factor is not commonly used in multifactor strategies, but we think it is a useful metric that considers the diversification potential of stocks with lower correlation. Because they are some of the largest companies in the S&P 500, these companies have a high correlation to the broader market. As a result, all rank in the bottom 25% by correlation. In our view, this has been driving the recent narrative that big tech firms are dominating the returns of the S&P 500.
- Fundamental Measures
- Value: Apple ranks in the top 25% by WisdomTree’s composite value measure. Facebook and Alphabet are in the middle of the pack at 48% and 53%, respectively, and Netflix and Amazon rank as the growthiest of the bunch.
- Quality: What differentiates these tech-focused firms most notably from the large tech firms of the dot-com bubble is their profitability. All rank in the top 50% by our quality score, with Facebook and Apple the strongest.
None of the FAANGs score particularly poorly by any individual multifactor score, aside from our expected results from correlation. By their composite multifactor scores, four out of the five score at around 35-44%, with Apple being the notable exception with an impressive score of 55%. As the only dividend payer of the FAANGs, Apple is the only one currently eligible for inclusion in the WisdomTree Index, sporting a healthy 4.2% weight.
Higher Return on Equity (ROE) at a Discount to the S&P 500
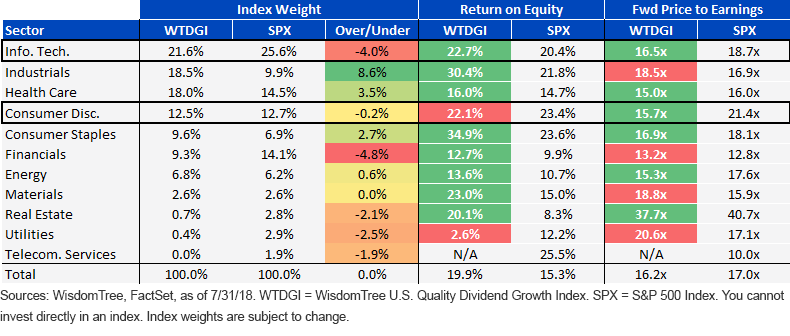
A strong argument that is often made by value investors wary of exposures to tech is the premium that they typically command. Information Technology and Consumer Discretionary are the most expensive sectors within the S&P 500, excluding Real Estate . Within WisdomTree’s Index, Information Technology and Consumer Discretionary are trading at 16.5 and 15.7 times forward earnings, both at significant discounts to their respective sector valuations in the S&P 500, and at a discount to the 17x for the S&P 500 Index.
The discount offered by these sectors is accompanied by a significant improvement in profitability. The ROE measures of Information Technology and Consumer Discretionary are 22.7% and 22.1%, respectively, a roughly 700 basis point improvement from the S&P 500 ROE of 15.3%.
Sector Fundamentals

Conclusion
As with WisdomTree’s other fundamentally weighted strategies, no manager is making active bets to include/exclude or be over-weight/under-weight in certain FAANG companies. Instead, our methodology seeks to reward companies with attractive valuations and be under-weight in those that lag their peers. For investors concerned about certain tech companies’ performance beginning to outpace fundamentals, we would encourage them to consider a focus on quality dividend payers to mitigate valuation risks. The WisdomTree U.S. Quality Dividend Growth Index provides a valuation discipline without making an embedded extreme active bet away from the largest sector in the S&P 500 that other dividend-focused strategies tend to make.


