U.S. Treasuries: “Because I Was Inverted”


No, the Treasury yield curve is not quite like Maverick was in Top Gun, but it’s getting close. Over the last year, the discussion surrounding the potential for an inverted yield curve, and what that event could be signaling from a broader macroeconomic backdrop, has picked up steam. Well, here we are on the cusp of longer-dated yields being below shorter-dated rates, and investors still seem to be trying to figure out if this time will be different.
As I’ve written in prior postings, my preferred yield curve gauge measures the differentials between the U.S. Treasury (UST) 2-Year note and the 10-Year note. This relationship has a deep history and has not been impacted by changes in Treasury issuance patterns, such as we see for t-bills and 30-year bonds. In the case of t-bills, the nation’s debt managers adjust auction sizes more frequently to help manage financing needs, while for the bond, there actually was a period of about five years (August 2001–February 2006) when the 30-year maturity was discontinued.
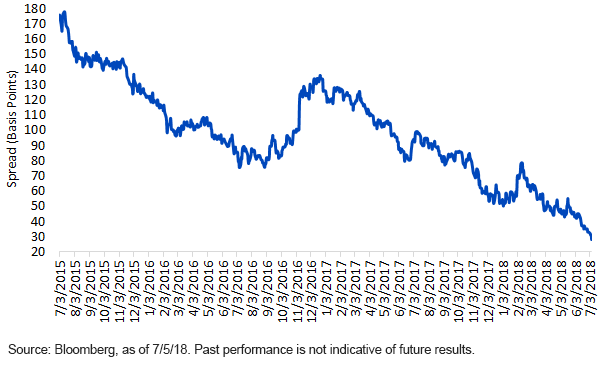
U.S. Treasury 2-Year vs. 10-Year

As of this writing, the UST 2-Year/10-Year spread had fallen to only +28 basis points (bps), the narrowest reading since 2007. With the first half of 2018 in the books, this spread has been cut almost in half and has contracted 50 bps from the recent peak in February. To put things into perspective, this differential was residing at nearly 100 bps a year ago. Interestingly, the renewed spread narrowing over the last few months has its genesis in two factors: the UST 2-Year yield rising due to Federal Reserve (Fed) rate hikes and the 10-Year yield falling from its mid-May high point. However, the 10-Year yield has not declined due to concerns of the Fed pushing the economy into a recession, but rather as a function of safe-haven demand stemming from Italy’s bond market chaos and concerns of an escalating trade war. In fact, there have also been reports of pensions buying at the long end because of the language in the recent tax cut legislation.
Since history has shown that inverted yield curves have typically preceded recessions, and given the length of the current economic recovery, concerns about its sustainability going forward have arisen, with any signal that a potential downturn could be on the horizon getting extra attention. The general school of thought is that an inverted yield curve indicates a pending recession in about a year’s time. It certainly is not a perfect science in this regard, but it has definitely served as a useful predictive tool. Over the last 40 years, the only time an inverted UST 2-Year/10-Year spread did not “predict” a recession roughly 12 months out was in 1998.
Conclusion
In order to go inverted going forward, two things need to happen. First, the Fed needs to maintain its pursuit of rate hikes, even if they are just gradual, and second, the 10-Year part of the curve needs to remain in its current range-bound pattern. Thus, by doing the math, another couple of rate hikes would seemingly tip the scales into negative territory. However, an inversion this time around would not be caused by the Fed trying to cool off an overheating economy. Instead, its goal is to try to normalize monetary policy within the confines of growth hovering around +2.5% and inflation straddling the 2% target.
Unless otherwise stated, all data sources for this blog post are as of July 5, 2018.


