Time to Move from FAANGs to SEPTICS?


A half-century ago, when investors fell in love with the “Nifty 50,” the darling mega-caps of the era that many advised to buy and hold forever, they at least had the ability to choose from among companies that spanned numerous industries (components such as PepsiCo, Schlumberger, Pfizer1 and so on were in completely different businesses). Not so with today’s “nifty” group, the FAANG stocks: Facebook, Amazon, Apple, Netflix and Google’s parent, Alphabet. And being in or out of them could be critical for U.S. equity success in coming years.
It’s been a great run thus far for the five “new economy” dynamos, their performance over the last half-decade nothing short of stellar. We unscientifically compiled a list of non-FAANG industries with the sole purpose of coming up with an off-putting acronym. The “SEPTICS” stocks are the anti-FAANGs—companies that have not taken the same road to riches in recent years. Comprising Specialty Retail, Electric Utilities, Packaged Foods, Tobacco, Insurance, Chemicals and Soft Drinks, this motley crew is the “who’s who” of industries that give little ammunition to braggarts. Between them, they encompass a not insignificant 83 of the S&P 500’s companies and 11.2% of the Index.2
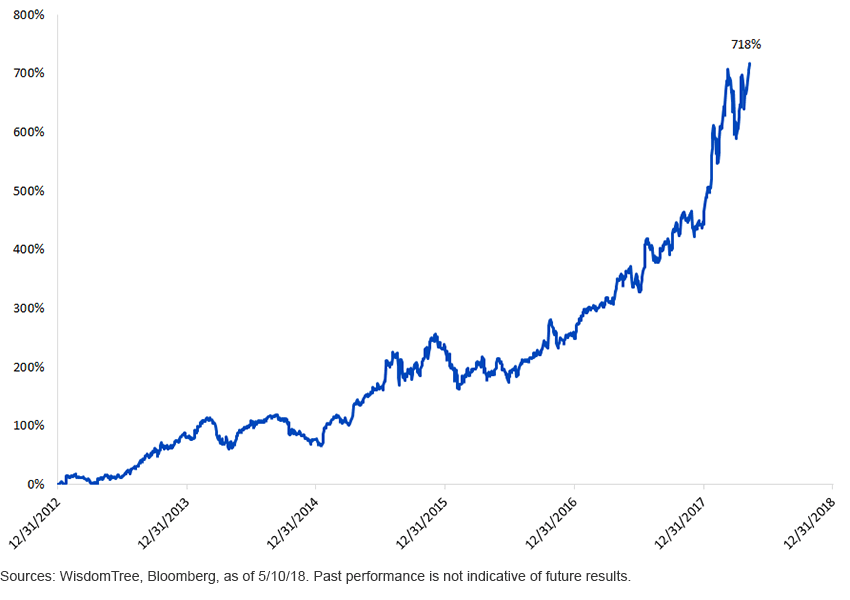
This basket not only didn’t lose money but rallied more than 60% from December 31, 2012, to May 10, 2018. No matter; the FAANG stocks beat it by more than 700 percentage points (figure 1).
Figure 1: Cumulative Return Differential: FAANGs minus SEPTICS

That kind of run is a reason that one out of every eight dollars in the S&P 500 is now in the FAANG five. But the truth is that we could have pulled almost any combination of five or six industries, concocted a funny acronym like “SEPTICS” and the FAANG stocks still probably would have crushed it. It wouldn’t have mattered if SEPTICS returned 60% or 160% or 260%. Even the last figure would have handily outpaced the S&P’s 91% run-up but would have lagged the FAANG stocks.
FAANGs in WisdomTree
Figure 2 shows the FAANG holdings of WisdomTree’s six major U.S. equity ETFs, originally compiled in a prior blog post. Aside from the WisdomTree U.S. Earnings 500 Fund (EPS), which is our earnings-weighted 500-stock answer to the S&P, many of our ETFs shun the FAANG stocks entirely or nearly so.
Figure 2: WisdomTree ETFs’ FAANG Exposure

This is where WisdomTree’s rules-based strategies come into play; if the rules don’t identify Amazon, Amazon is out. And if they aren’t picking up Facebook either, Facebook gets a “zero.” Remember, if it weren’t for the 1990s tech bubble and mass movements before it, there wouldn’t even be a WisdomTree and you wouldn’t be reading this post. That’s because that era’s market distortions catalyzed WisdomTree’s founders to create ETFs that were weighted by fundamental metrics. So if the WisdomTree U.S. Quality Dividend Growth Fund (DGRW) is 8 percentage points under-weight the FAANG stocks, we will let time be DGRW’s judge. The WisdomTree U.S. Multifactor Fund (USMF) and the WisdomTree U.S. High Dividend Fund (DHS) are even bolder, owning none of them, a 12% under-weighting. Time will judge them too.
In or Out
Maybe the FAANG stocks will keep growing until they take over the universe. But if they don’t, there is plenty of precedent for seemingly unstoppable stocks to fall from grace. WisdomTree’s U.S. equity ETFs are by and large avoiding the FAANG stocks. FAANG skeptics, seek “SEPTICS.”
1Please click on the following WisdomTree ticker symbols to see each Fund’s holdings percentage of PepsiCo, Schlumberger and Pfizer: EPS, DLN, QSY, USMF, DHS, DGRW.
2Sources: WisdomTree, Bloomberg, as of 5/10/18.
Important Risks Related to this Article
Statements concerning financial market trends are based on current market conditions, which will fluctuate. References to specific securities and their issuers are for illustrative purposes only and are not intended to be, and should not be interpreted as, recommendations to purchase or sell such securities.
There are risks associated with investing, including possible loss of principal. Funds focusing their investments on certain sectors may be more vulnerable to any single economic or regulatory development. This may result in greater share price volatility. Due to the investment strategy of some of these Funds, they may make higher capital gain distributions than other ETFs. When a Fund is actively managed, the Fund’s investment process is expected to be heavily dependent on quantitative models, and the models may not perform as intended. Please read each Fund’s prospectus for specific details regarding the Fund’s risk profile.


