Unwrapping the Mystery of Dollar Depreciation in 2017


One of the biggest surprises for us in 2017—given major macroeconomic factors such as central bank policy divergence—was the depreciation of the U.S. dollar. Many anticipated that if the U.S. central bank hiked rates while foreign central banks were expanding balance sheets, that would be a catalyst for a stronger U.S. dollar.
And yet the opposite happened.
Over the course of a few blog posts, we aim to provide context for the behavior of the U.S. dollar in 2017 and how that might enhance our understanding of what might happen in 2018 and beyond.1
2017: Broad-Based Dollar Depreciation

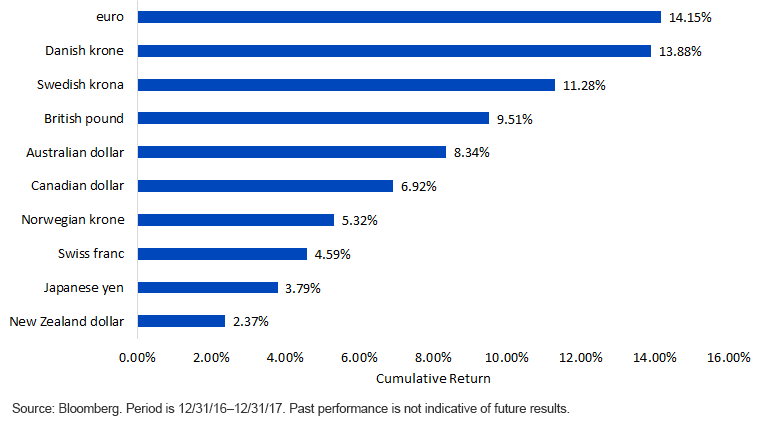
- There was broad dollar weakness in 2017. The chart above shows the performance of the U.S. dollar against the G10 currencies during 2017. The critical point is that this wasn’t a phenomenon confined to one or two of the major currencies but, rather, all of them.
- It’s also worthwhile to consider the performance of the U.S. dollar in terms of major indexes. The U.S. Dollar Index (DXY) is one of the longest standing, and it is heavily tilted toward the euro and the yen in its exposure. DXY was down 9.9% in 2017. The Bloomberg Dollar Spot Index, which WisdomTree worked with Bloomberg to create in 2013, is more balanced in its exposures and was down 8.5%.2
- The MSCI Emerging Markets Index had a great year in 2017. For U.S. dollar-based investors, returns were helped by a cumulative 5.2% appreciation against the dollar by emerging market currencies.3
Examining the Apparent Disconnect between Policy and Performance
Especially after the global financial crisis of 2008–2009, central bank policy—particularly the actions of the Federal Reserve (Fed), the European Central Bank (ECB) and the Bank of Japan (BOJ)—is discussed and publicized almost daily. Here’s a recap of the last few years:4
- As of the end of November 2015, the Fed’s effective policy rate was .08%, and there had as of yet been no hikes going all the way back to the global financial crisis. As of May 4, 2018, the effective policy rate is now 1.69%, signifying six hikes, 25 basis point (bps) each.
- As of the same starting point, the ECB’s main refinancing rate was .05%. Currently, this rate is at .00%, and it has been there for some time.
- The BOJ initially had its policy rate at .10%. Currently, this rate is at -.10%, and it has been there for an extended period.
Bottom line: The Fed embarked on a multiyear path of policy normalization, whereas the BOJ and the ECB have not. Many have looked at this—it was widely telegraphed to markets by all three of these institutions—and have assumed that a stronger U.S. dollar was basically a foregone conclusion.
The Connection between Expected Policy & Enacted Policy
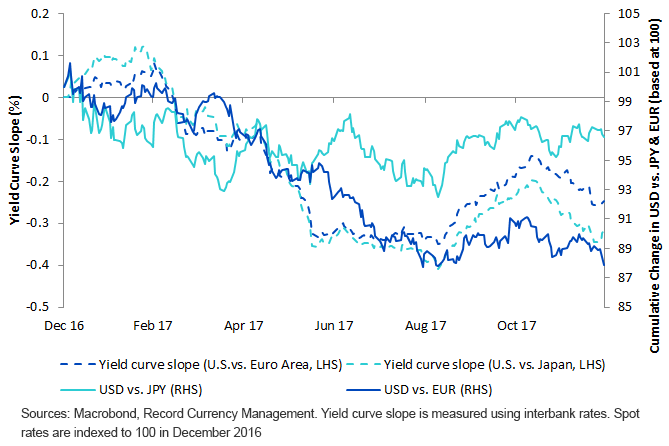
Yield Curve Slopes and Spot Rates (12/31/16−5/1/18)

A critical part of the story outlined above is just how much information and communication central bankers are publicizing about their policy expectations. The actual difference in policy rates does not do a great job of capturing market expectations of future policy—rather, it confirms that what market participants have been told ahead of time is actually happening.
- The dotted lines measure the difference between the one-year and one-month interbank rates for the U.S. minus that of either the eurozone or Japan. A falling value, therefore, tells us that the gap between the one-year and one-month rate in the specified market outside the U.S. is widening faster than inside the U.S. An interpretation of this is that markets are “pricing in” expected short-term rate hikes in these respective markets and that expectations for the BOJ and ECB to raise rates were being factored into these interest rates during 2017.
Putting a Story to the Data
We cannot overstate the importance of the shifting yield curve data because this conveys an evolving narrative for the U.S. dollar—one that will continue to contribute to future movements.
1. The Fed basically did what it had communicated and what was expected. This did not impact future expectations because we saw the yield curves moving in a direction that implied less of a gap between the U.S. and the other markets.
2. They also reflect that—due to strong data out of the euro area, particularly in 2017—markets were starting to expect future rate hikes out of the ECB and then even Japan. These factors did impact the yield curve slopes as well as how the market was pricing future currency behavior.
3. Unfortunately, there is more to the story, as there also was a shift in relative slope directions toward the end of 2017, signaling falling euro area and Japanese short-term rate expectations against the U.S. This move did not translate into any significant dollar strength versus the euro or yen, telling us that other factors were more dominant at that time.
Monitor the Inflection Points
Euro area data in 2018 has been nothing like what we observed in 2017. In 2017, the narrative placed strong credence on an ECB exit path starting at the end of September 2018. Now, that might be less certain, and we have seen the euro pull back from its gains.
From an investor flow perspective, much of European equity exposure in 2017 went into unhedged strategies that are fully exposed to the euro’s movements. We’d question the long-run rationale for that euro bet and suggest employing an intentional currency program to have exposure when one has a positive view on the euro. The data brings increasing questions around that long euro bet in the short run.
1We’d like to thank Record Currency Management, a global thought leader on currencies, for analytical support in this blog series.
2Source: Bloomberg, with data for the period 12/31/16–12/31/17.
3Source: Bloomberg, with data for the period 12/31/16–12/31/17.
4Source: Bloomberg, with data measured for the period 11/30/15–5/4/18.

Christopher Gannatti began at WisdomTree as a Research Analyst in December 2010, working directly with Jeremy Schwartz, CFA®, Director of Research. In January of 2014, he was promoted to Associate Director of Research where he was responsible to lead different groups of analysts and strategists within the broader Research team at WisdomTree. In February of 2018, Christopher was promoted to Head of Research, Europe, where he was based out of WisdomTree’s London office and was responsible for the full WisdomTree research effort within the European market, as well as supporting the UCITs platform globally. In November 2021, Christopher was promoted to Global Head of Research, now responsible for numerous communications on investment strategy globally, particularly in the thematic equity space. Christopher came to WisdomTree from Lord Abbett, where he worked for four and a half years as a Regional Consultant. He received his MBA in Quantitative Finance, Accounting, and Economics from NYU’s Stern School of Business in 2010, and he received his bachelor’s degree from Colgate University in Economics in 2006. Christopher is a holder of the Chartered Financial Analyst Designation.

