Euro Depreciation: The Key to Unlocking the Value in European Exporters


One of the biggest surprises of 2017 was the fact that the euro exchange rate measured against the U.S. dollar appreciated 14%—only about 7% behind the performance of the S&P 500 Index over the same period.1
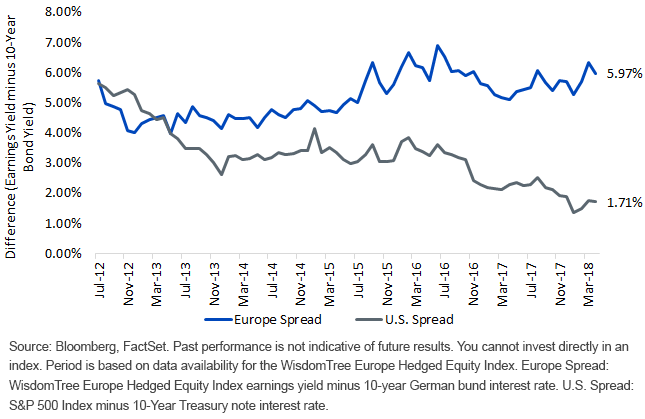
The Consequence: European Equities Look Quite Attractive (7/31/12–4/30/2018)

- This spread illustrates one consequence of a central bank policy divergence, as the 10-year German bund was around .60%, approximately one-fifth of the 2.95% where we saw the U.S. 10-Year. Yes, the current earnings yield of the WisdomTree Europe Hedged Equity Index is about 190 basis points higher than that of the S&P 500 Index, but an even greater reason for the difference in spread is the very low position of German interest rates.
- Our European equity Index is focused on export-oriented companies that derive more than 50% of their revenues from outside of Europe. The euro’s performance is important, therefore, in that a weaker euro creates a stronger fundamental backdrop for the earnings of these companies.
Interest Rates Matter
Central bank policy divergence has been one of those “big themes” often discussed among market participants around the world, and along those lines, many would then cite the policy rates first because these are what the central banks directly influence.
However, it is also important to look further out on the interest rate curve. Ten-year government bond interest rate differences between Germany and the U.S. indicate a broader spectrum of differences beyond central bank policy and could indicate both growth and inflation differentials.
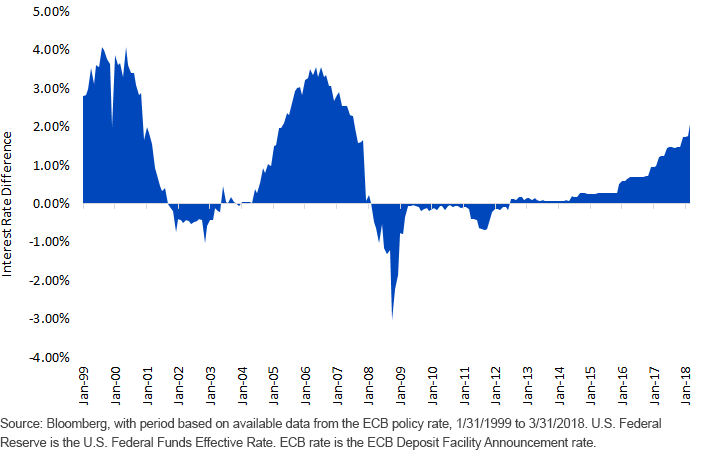
Difference in Central Bank Policy Rates: U.S. Federal Reserve Minus European Central Bank (ECB)

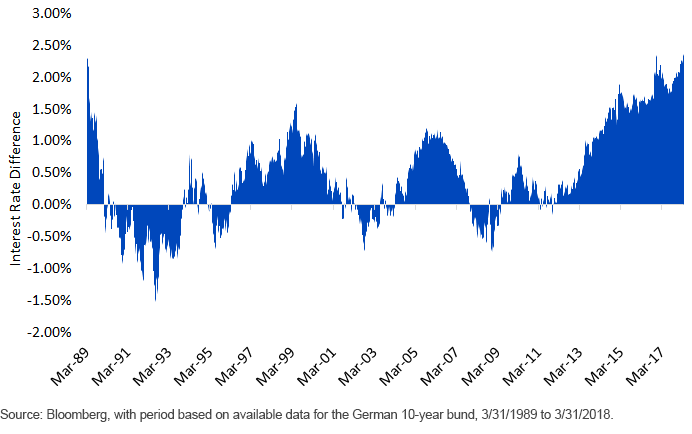
Difference in U.S. 10-Year Treasury Interest Rate Minus 10-Year German Bund Interest Rate

- Policy Rates: It is very clear that the U.S. central bank has tended toward a higher policy rate than the ECB over the vast majority of the period that we can analyze. The difference peaked—meaning the Fed policy reached its highest level in a relative sense—in 2000 and in 2006. The critical question is whether we are traveling toward a third peak, being currently at about a 2% difference, around half of the historical maximum in the 4% range.
- 10-Year Government Bonds: Going back to 1989, the U.S. 10-Year had an approximate 2.3% to 2.4% yield advantage over the 10-year German bund. Markets had to wait until the current period for this level of difference was reattained—a period of nearly 30 years. This means a couple of things: 1) the U.S. has much higher growth/inflation expectations than the eurozone over the next 10 years, and 2) European investors have an opportunity to pick up a historically large spread when investing in U.S. government debt.
Bottom line: These spreads favor a stronger U.S. dollar and a weaker euro. Now, we’re careful to say “favor” because other factors clearly influence the picture. The market has known about these developments for some time and the euro is still trading at around €1.19 to the U.S. dollar, as of this writing.
2018: Will the ECB Begin Tapering?
The April 26, 2018, ECB press conference went as expected—not much in the way of new information, and policy will be assessed flexibly on an ongoing basis. As of now, we know that the asset purchase plan will continue at a rate of €30 billion per month through September this year. Data may lead this to be extended, but as yet we do not have that new information—we just know that indicators such as the Citi Economic Surprise Index haven’t been at their most positive thus far in 2018. Extending the time frame for easing—contingent, of course, on economic data—may come to light in June. If we can assume this is not currently priced into the euro, then it may be a catalyst for euro weakness.
U.S. 10-Year Broke 3%—A Short-Term Case Study of Euro Weakness & Equity Prices
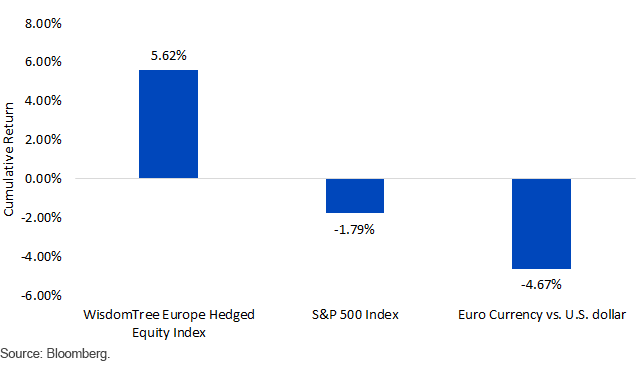
Recent Euro Depreciation (2/15/18–5/7/18)

- February 15, 2018, was a near-term peak in the euro, when it traded above 1.25. As of this writing, it is trading around 1.19, implying approximate depreciation of 4.7%. This represents an important example of what can happen to European exporters—shown through the WisdomTree Europe Hedged Equity Index—when the euro weakens: outperforming the S&P 500 Index over this period by about 7.4% cumulatively.
Conclusion: A Weaker Euro Could Unlock Valuation Potential of European Exporters
We’ve seen the U.S. 10-Year break through 3% for the first time since early 2014, and we’ve written about the appointment of Larry Kudlow to the Council of Economic advisors and possible “King Dollar” policy. We had a glimpse of this over the past few weeks, and now we will have to examine the staying power of this trend.
1Source: Bloomberg, with 2017 performance measured from 12/31/16 to 12/31/17.

Christopher Gannatti began at WisdomTree as a Research Analyst in December 2010, working directly with Jeremy Schwartz, CFA®, Director of Research. In January of 2014, he was promoted to Associate Director of Research where he was responsible to lead different groups of analysts and strategists within the broader Research team at WisdomTree. In February of 2018, Christopher was promoted to Head of Research, Europe, where he was based out of WisdomTree’s London office and was responsible for the full WisdomTree research effort within the European market, as well as supporting the UCITs platform globally. In November 2021, Christopher was promoted to Global Head of Research, now responsible for numerous communications on investment strategy globally, particularly in the thematic equity space. Christopher came to WisdomTree from Lord Abbett, where he worked for four and a half years as a Regional Consultant. He received his MBA in Quantitative Finance, Accounting, and Economics from NYU’s Stern School of Business in 2010, and he received his bachelor’s degree from Colgate University in Economics in 2006. Christopher is a holder of the Chartered Financial Analyst Designation.

