
GULF: Being True to “Global” Asset Allocation


WisdomTree’s Middle East Dividend equity ETF, GULF, gets only a fraction of the attention of our bigger funds, and the reason may be because of human nature: Middle East equities have had a “lost decade” that investors would rather forget.
Since it was incepted in June 2008, the WisdomTree Middle East Dividend Index, which GULF tracks after fees and expenses, has returned -0.36% per year. In contrast, the MSCI Emerging Markets Index and the S&P 500 are up 4.22% and 10.95% per year, respectively.1
Yet despite the performance trouble confronted by Middle Eastern equities over those years, GULF witnessed spells during which it had diversified emerging market risk considerably. For example, emerging markets were down 2.4% in 2013, but GULF returned 37.1%. Emerging markets declined marginally the very next year too, and yet GULF posted gains of 11.4% in 2014.2 Not surprisingly, WisdomTree’s Middle East Index has shown historic correlations to emerging, developed and U.S. stock markets of 0.64, 0.68 and 0.64, respectively, potentially aiding in diversification efforts.3
Because gains have been elusive through the years, GULF has not witnessed the valuation expansion that tends to pre-occupy investors in other markets; the Index that it tracks is priced at 11.1 times trailing earnings, with a dividend yield of 4.95%.4
In contrast, the S&P 500 is trading for 21.3 times trailing earnings, with a 1.93% dividend yield, pricier than broad emerging and frontier markets.5 That means that these Gulf nations offer a dividend yield spread of 302 basis points (bps) over U.S. equities and a P/E multiple that is essentially half as much as the U.S.
Where it gets interesting is in the credit default swaps (CDS) market, where such yawning valuation disparities are not being confirmed, indicating that an opportunity may be presenting itself in Gulf equities.
Credit Markets Like the Sunni Monarchies
In figure 1, we see the cost of insuring five-year obligations of various governments, with the U.S. and several emerging market nations presented to place the Middle Eastern nations in context.
For an idea of scale, the cost of default insurance for the U.S. is 0.20%, which means that an annual payment of $20,145 per year insures $10 million of U.S. Treasuries.6 In GULF’s case, A1-rated Saudi Arabia, Aa2-rated United Arab Emirates and Aa3-rated Qatar7 currently combine to 70% of the WisdomTree Middle East Dividend Index, and each has tame sovereign risk in the eyes of the CDS market. At 0.84%, 1.05% and 0.94%, they require annual payments of $83,893, $104,580 and $93,668 to insure $10 million in notional value of government debt, respectively.
Figure 1: 5-Year Credit Default Swaps Pricing
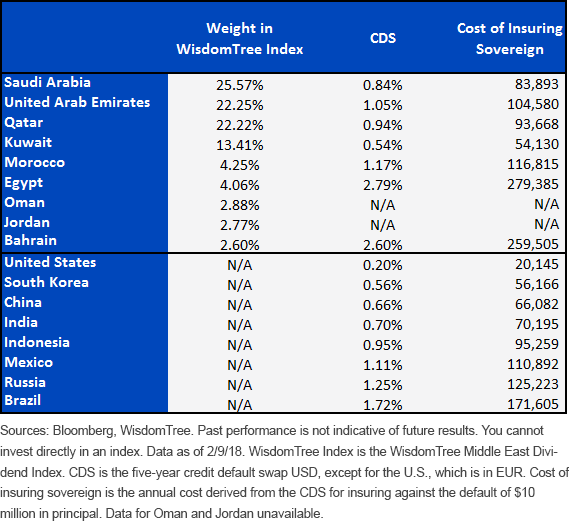
In many cases, the credit markets view the pricing on Gulf Corporation Council (GCC) state debt somewhere in the middle of the pack if they were classified as emerging markets. Kuwait is one example of a sovereign that can be trusted more than almost all of the listed emerging markets, at least as far as the CDS market is concerned.
And if sovereign debt pricing is any indicator of potential equity risk in these frontier markets, the Mideast could be presenting a basket of stocks that has a risk profile akin to emerging markets, but with a valuation margin of safety included.
Being True to “Global”
Just how global is “global”? As an industry, we often think in terms of indexes like the MSCI All Country World in developing an asset allocation framework. The MSCI Index excludes Saudi Arabia, Kuwait, Morocco and many others, so it’s not exactly “All Country.” Then, when countries with small total stock market sizes do appear on the list, their proportions are often a rounding error. The result is “global” portfolios that have plenty of exposure to the U.S., Britain, Japan and so on, and little or nothing in the way of markets that have traditionally been left on the outside looking in.
Please consult our big-picture case for GULF, where we discuss concepts such as Saudi cultural reform and China’s multitrillion-dollar infrastructure build-out, key issues that could be critical to the success or failure of the GULF investor.
1Source: Bloomberg, 6/30/08–1/31/18.
2Source: Bloomberg, using MSCI Emerging Markets Index. For most recent month end and standardized performance of GULF, please click here. Performance is historical and does not guarantee future results. Current performance may be lower or higher than quoted. Investment returns and principal value of an investment will fluctuate so that an investor’s shares, when redeemed, may be worth more or less than their original cost. Performance data for the most recent month-end is available at www.wisdomtree.com.
3Monthly correlations with MSCI Emerging Markets, MSCI EAFE and the S&P 500, 6/30/08–1/31/18.
4Source: Bloomberg, as of 2/11/18.
5Sources: Bloomberg, WisdomTree, as of 2/12/18.
7Source: Moody’s, as of 2/12/18. Moody's credit ratings are published rankings based on detailed financial analyses by the credit bureau specifically as it relates to the countries' ability to meet debt obligations. The highest rating is Aaa, second highest is Aa, and the lowest is C. Moody's appends numerical modifiers 1,2, and 3 to each generic classification from Aa through Caa.The modifier 1 indicates that the obligation ranks in the higher end of its generic rating category.
Important Risks Related to this Article
There are risks associated with investing, including possible loss of principal. Foreign investing involves special risks, such as risk of loss from currency fluctuation or political or economic uncertainty. This Fund focuses its investments in the Middle East, thereby increasing the impact of events and developments associated with the region, which can adversely affect performance. Investments in emerging, offshore or frontier markets such as the Middle East are generally less liquid and less efficient than investments in developed markets and are subject to additional risks, such as risks of adverse governmental regulation and intervention or political developments. As this Fund has a high concentration in some sectors, the Fund can be adversely affected by changes in those sectors. Due to the investment strategy of this Fund, it may make higher capital gain distributions than other ETFs. Please read the Fund’s prospectus for specific details regarding the Fund’s risk profile.
Share & Comment
Popular Posts
Categories
Related Links