
U.S. Quality Dividend Growth: An Alternative to the S&P 500


We are coming up on five years since we launched the WisdomTree U.S. Quality Dividend Growth Fund (DGRW), our $2.13 billion ETF1 that tracks the WisdomTree U.S. Quality Dividend Growth Index. Its benchmark is the NASDAQ US Dividend Achievers Select Index, but figure 1 also includes the S&P High Yield Dividend Aristocrats and the S&P 500 Indexes.
Figure 1: WisdomTree U.S. Quality Dividend Growth Index (Hedged Units) Performance
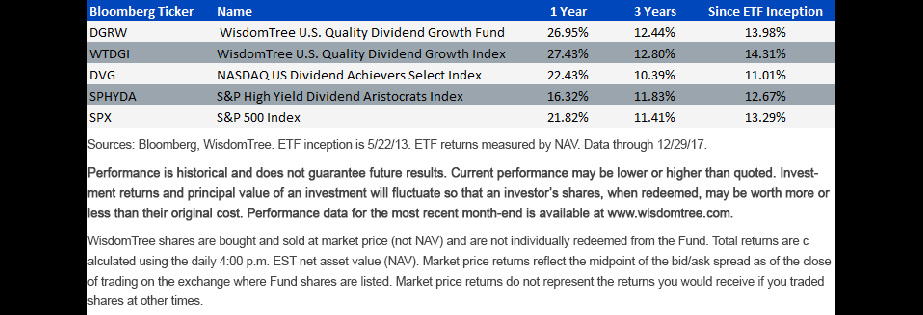
Click here for DGRW standardized performance.
The Fundamentals Quilt
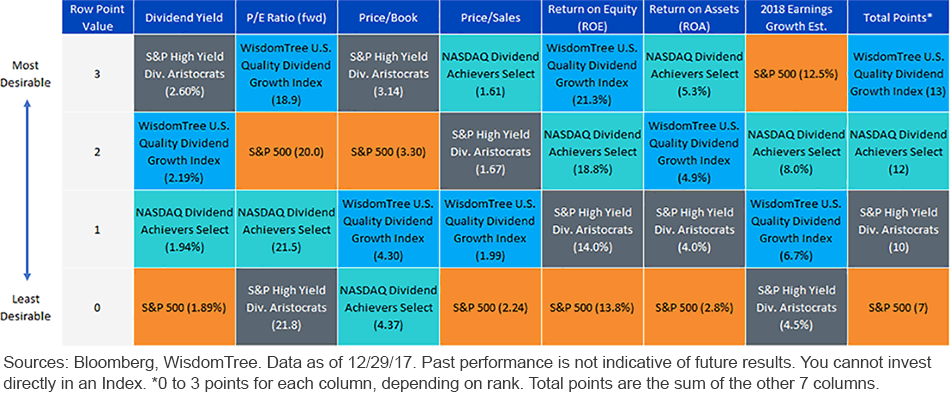
Figure 2 shows a “periodic table” or “quilt” for the fundamentals of the WisdomTree U.S. Quality Dividend Growth Index, along with the other Indexes.
The top of the table is most desirable, and each appearance there gets 3 “points,” with lower points below. The far-right column sums the points. For example, the S&P High Yield Dividend Aristocrats Index’s 2.60% dividend yield is the highest of the four Indexes, so it gets 3 points for that column. The Index’s sum of 10 points for all columns is shown on the right.
Strikingly, the S&P 500 often appears in the very last row. It gets just 7 points. The WisdomTree Index gets 13.
Figure 2: U.S. Equity Fundamentals “Quilt”
Smart “Beta” or Modern “Alpha”?
A metric in figure 2 jumps out for investors who focus on profitability for shareholder wealth creation—and that’s the WisdomTree Index’s 21.3% return on equity, about 8 percentage points more than the S&P 500. Both the WisdomTree Index and the S&P 500 pay out a bit more than 40% of their earnings in dividends, retaining the rest. Investors have a choice with respect to the nearly 60% of earnings retained: own a collection of firms that redeploy capital at middling ROEs or own a different group at high ROEs.
That’s how we designed the Index; the strategy is to improve upon the S&P’s profitability metrics, not mirror them. What we’re doing isn’t smart beta; it’s something else, a rules-based alpha generator. It’s modern alpha.
Investors can choose from two paths in 2018: they can dive in with money managers who are indexing or closet-indexing the S&P 500. If their portfolio mimics the S&P, they will have stocks that pay a 1.89% dividend, trade for 20 times forward earnings and have an ROE of 13.8%. Or they can take the other path, which displays ROEs that are significantly higher than those of the S&P, with a lower P/E (18.9) and a higher dividend yield (2.19%).
DGRW can fill an asset allocation’s U.S. equity sleeve because the nature of the screen—300 companies weighted by their dividend amounts—identifies mainstream top holdings like Exxon Mobil, Johnson & Johnson and Wells Fargo. It’s a broad allocation that is designed for major pieces of portfolios.
We designed our Index this way because we don’t want investors treating DGRW as a fund that can “satellite around”2 active managers or the S&P 500. We are pulling the curtain back on the S&P 500 and funds that track it because modern alpha concepts such as the ones used in this ETF can take over the core of a portfolio.
1Source: Bloomberg, as of 3/7/2018.
2A reference to a “core-satellite” strategy, where a main fund or ETF represents the bulk of the allocation, while other smaller holdings act as satellites around it, much as the massive sun dominates the solar system while the tiny planets satellite around it.
Important Risks Related to this Article
There are risks associated with investing, including possible loss of principal. Funds focusing their investments on certain sectors increase their vulnerability to any single economic or regulatory development. This may result in greater share price volatility. Please read the Fund’s prospectus for specific details regarding the Fund’s risk profile.
References to specific securities and their issuers are for illustrative purposes only and are not intended to be, and should not be interpreted as, recommendations to purchase or sell such securities.
Share & Comment
Popular Posts
Categories
Related Links