Managing Valuation Risks as Market Multiples Rise in Mid- & Small Caps


On February 1, 2007, WisdomTree launched its U.S. Earnings family of Indexes. Over the course of this nearly 11-year live track record, many clients have asked us why we chose to weight these Indexes by earnings.
What’s happening in U.S. equities today provides an environment for a better answer than any we have been able to provide thus far. I have recently addressed the topic of managing valuation risk in large caps. Below I focus on the mid- and small-cap segments of the U.S. market.
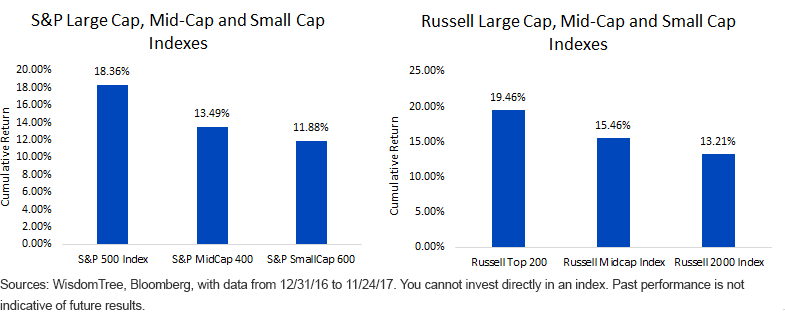
2017 has seen the Bloomberg Dollar Spot Index drop by 8.53%,1 creating a positive tailwind to the earnings of U.S. multinationals—predominantly larger companies. We see below that this has manifested in large caps outperforming both mid-caps and small caps in 2017.

For definitions of indexes in the chart, visit our glossary.
Even though large caps have been outperforming in 2017, if we instead focus on valuation, a similar step-wise progression exists in the opposite direction. The two large-cap Indexes (the S&P 500 Index and the Russell Top 200 Index) have trailing 12-month price-to-earnings (P/E) ratios of slightly below 22.0x. Both the S&P MidCap 400 and the Russell Midcap Indexes had P/E ratios of between 24.0 and 25.0x. The small caps were the most expensive, with the S&P SmallCap 600 Index trading at about 29.0x and the Russell 2000 Index trading slightly below 50.0x.2
The Difference of Negative Earnings
A P/E ratio of close to 50.0x stands out and probably leaves many thinking that there may be some sort of mistake or miscalculation. However, this draws out an important distinction between the Russell 2000 and the S&P SmallCap 600 Indexes. In the case of the S&P Index, there is a requirement for positive generally accepted accounting principles (GAAP) net income prior to companies gaining initial inclusion.3 The Russell 2000 Index has no such requirement4, and on a trailing 12-month basis, we’ve tended to see approximately 20% of the weight of the Russell Index in firms with negative earnings.5
Firms with negative earnings bring down the earnings per share of the full index, and this is the denominator of the P/E ratio formula. The price, or numerator, is not impacted, and so the result leads to a higher P/E ratio. Lower-quality small-cap indexes may therefore tend to have very high P/E ratios on the basis of their trailing earnings per share.
How Valuation Has Been Important
While valuation alone hasn’t been the best predictor of future market corrections (something many seem to be thinking about these days in this low-volatility environment), we have found it to be important over longer time frames in helping to set expectations for real returns from equities. Over a variety of long-term periods, work by Professor Jeremy Siegel in his book The Future for Investors has indicated that the after-inflation returns of equities have held a very close relationship to their earnings yield—the reciprocal of the P/E ratio. In short:
- Higher earnings yields (or lower P/E ratios) have been associated with stronger real returns.
- Lower earnings yields (or higher P/E ratios) have been associated with weaker real returns.
So if, for instance, we’re looking at the S&P SmallCap 600 Index with a trailing 12-month P/E ratio of 28.9x as of November 24, 2017, that is associated with a 3.5% earnings yield, and it becomes more challenging to see real, after-inflation returns to U.S. equities that are too different from this 3.5% level—at least if history is any guide.6
Where WisdomTree’s U.S. Earnings Indexes Can Help
WisdomTree’s U.S. Earnings Indexes follow two big-picture steps at their annual rebalance, screened on November 30 of each year:
- Include only profitable companies
- Weight companies by their core earnings
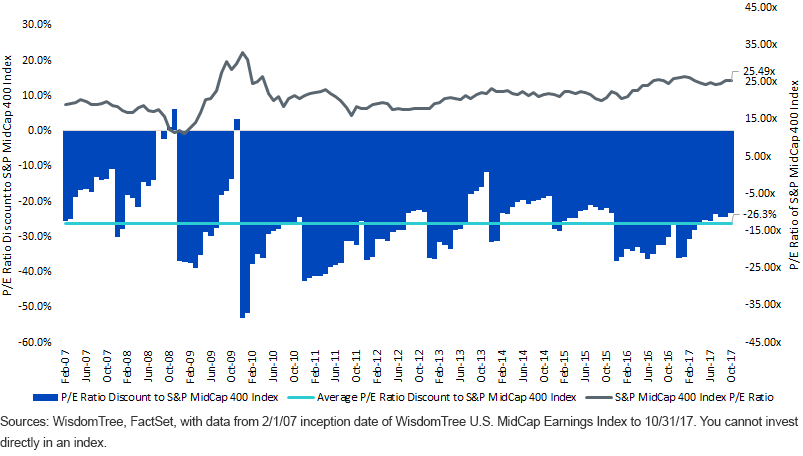
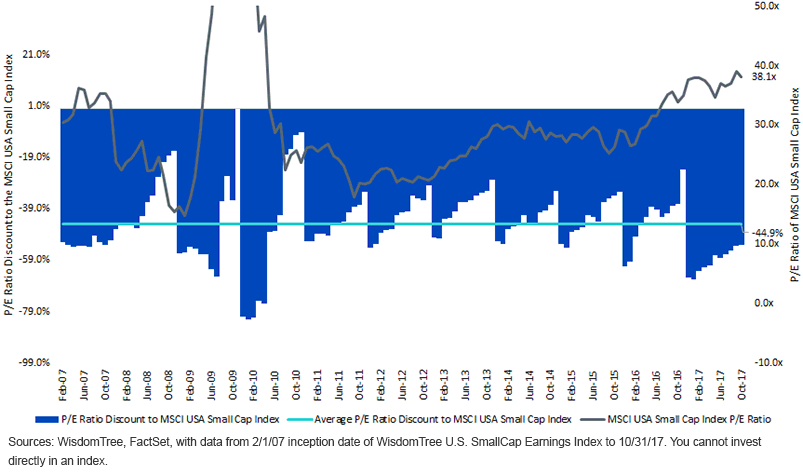
This process has tended to raise earnings yields (same thing said a different way: lower P/E ratios) compared to market capitalization-weighted universes of similar stocks. Below, we focus on the WisdomTree U.S. MidCap Earnings Index, which is highly comparable to the S&P MidCap 400 Index, and the WisdomTree U.S. SmallCap Earnings Index, which is highly comparable to the MSCI USA Small Cap Index.7
The WisdomTree U.S. MidCap Earnings Index Has Had a 26.3% Average P/E Ratio Discount Compared to the S&P MidCap 400 Index over Its Live History

The WisdomTree U.S. SmallCap Earnings Index Has Had a 44.9% Average P/E Ratio Discount Compared to the MSCI USA Small Cap Index over Its Live History

Conclusion: Why Does WisdomTree Have a U.S. Earnings Family of Indexes?
The bottom-line answer: This methodology has provided a capability to raise the earnings yield (or lower the P/E ratio) compared to a similar market capitalization-weighted universe of stocks. When searching for a strategy in an environment where the markets are experiencing overall lower earnings yields (or higher P/E ratios), this approach could be even more important when considering longer-run returns.
The current P/E ratios of 19.6x for the WisdomTree U.S. MidCap Earnings Index and 17.9x for the WisdomTree U.S. SmallCap Earnings Index, while elevated, represent discounts to the market to help investors manage the valuation risks of rising multiples.8 The higher the market multiples go, the more important we believe this methodology could become.
1Source: Bloomberg, with data from 12/31/16 to 11/24/17.
2Source for all P/E ratio data in No. 2 is Bloomberg, with trailing 12-month P/E ratios cited as of 11/24/17.
4Source: “Russell U.S. Equity Indexes v2.9,” FTSE Russell Construction & Methodology, 10/17.
5Sources: WisdomTree, Bloomberg, with most recent month-end data as of 10/31/17.
6Sources: WisdomTree, FactSet.
7For the purposes of this analysis, we do not utilize the S&P SmallCap 600 Index because it tends not to have more than 10% of its weight in firms with negative earnings over the prior 12 months, and we are unable to utilize the Russell 2000 Index as of this writing due to data constraints. As of 10/31/17, the MSCI USA Small Cap Index had 15% to 16% of its weight in firms with negative trailing 12-month earnings per share.

Christopher Gannatti began at WisdomTree as a Research Analyst in December 2010, working directly with Jeremy Schwartz, CFA®, Director of Research. In January of 2014, he was promoted to Associate Director of Research where he was responsible to lead different groups of analysts and strategists within the broader Research team at WisdomTree. In February of 2018, Christopher was promoted to Head of Research, Europe, where he was based out of WisdomTree’s London office and was responsible for the full WisdomTree research effort within the European market, as well as supporting the UCITs platform globally. In November 2021, Christopher was promoted to Global Head of Research, now responsible for numerous communications on investment strategy globally, particularly in the thematic equity space. Christopher came to WisdomTree from Lord Abbett, where he worked for four and a half years as a Regional Consultant. He received his MBA in Quantitative Finance, Accounting, and Economics from NYU’s Stern School of Business in 2010, and he received his bachelor’s degree from Colgate University in Economics in 2006. Christopher is a holder of the Chartered Financial Analyst Designation.

