DRW: The Detlef Schrempf of ETFs


Remember Detlef Schrempf? He’s the last basketball star awarded the NBA’s Sixth Man of the Year Award twice consecutively (in the 1990–1991 season and again in 1991–1992). The sixth man is the player who enters the game from the bench, while five others start the game. To me, REITs1 are like the Detlef Schrempf of the capital markets, because they play a critical role in asset allocation but often get overshadowed by the proverbial Michael Jordans of the world.
Until 2016, REITS were classified as a sub-industry inside the overarching financials sector, which was one of just 10 GICS “level one”2 sectors until last year. But now the GICS system, which is used by the likes of MSCI and S&P, views REITs as being independent enough to change the sector count to 11.
This is a major development for listed real estate because it wasn’t even until this century that REITs were added to the S&P 500, yet today that Index counts 33 real estate companies among its components.
In countries such as the U.S. and Australia, REITs have been a part of the investment landscape for generations, although they were widely popularized only in the last decade or so. In some major countries, like the UK and Italy, the REIT structure didn’t even come into being until 2007. It could still be early days for adoption of this sector.
The “Sixth Man” in Plain Sight
The WisdomTree Global ex-U.S. Real Estate Fund (DRW), the ETF that tracks the WisdomTree Global ex-U.S. Real Estate Index, covers securities worth $1.21 trillion, a considerable sum that is equal to 5.9% of the $20.4 trillion valuation accorded non-U.S. equities.3
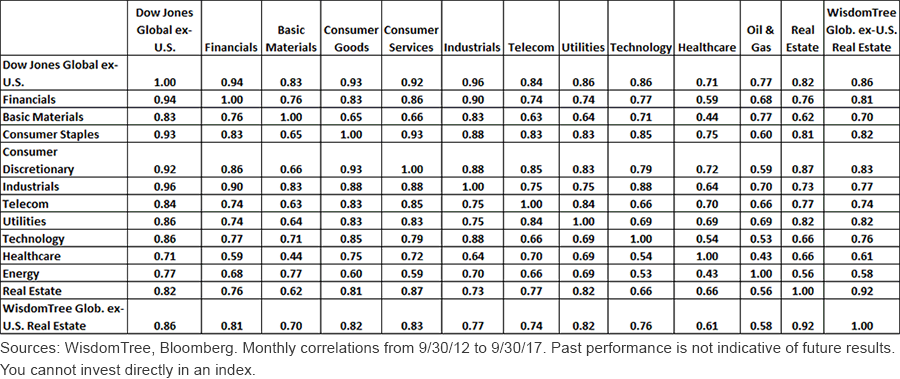
Importantly, because REITs are interest rate-sensitive, their correlation to broad equities is often lower than most other sectors. In figure 1, we see that the Dow Jones Global ex-U.S. Select Real Estate Securities Index has a correlation to the broad market Dow Jones Global ex-U.S. Index of 0.82, the third lowest correlation to the broad market of all 11 sectors. Not surprisingly, the WisdomTree Global ex-U.S. Real Estate Index had a similar correlation to the global equity index (0.86). The correlation between the two real estate proxies was 0.92.
Figure 1: Correlation Matrix: WisdomTree Global Ex-U.S. Real Estate Index vs. Dow Jones Global ex-U.S. Index

A Truly Global Perspective
Some investors think of the Dow Jones Global ex-U.S. Select Real Estate Securities Index when they consider international REITs. In terms of performance, DRW has returned 0.62% annually since it was incepted on June 5, 2007, more than a percentage point above the 0.53% annual loss generated for the Dow Jones Index. See standardized performance of the DRW Fund here.
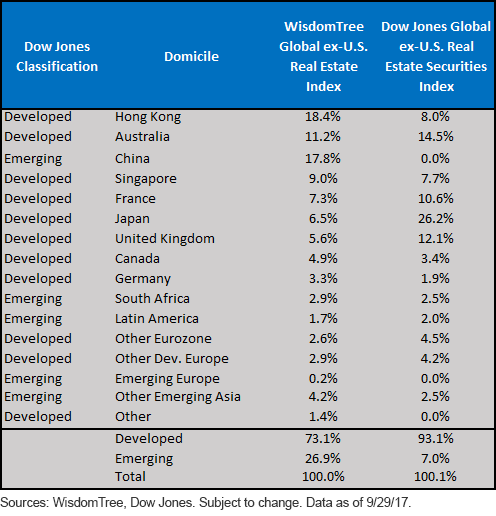
DRW’s underlying Index also gives more expansive coverage of the non-U.S. global real estate picture because it includes a healthy dose of emerging markets. For example, whereas the real estate subcomponent of the Dow Jones Index holds 7% in emerging markets, the WisdomTree Index has more than one-fourth of its exposure there (figure 2).
Figure 2: Country Allocations, WisdomTree vs. Dow Jones

We believe these differing international exposures have been a key driver of returns in 2017. In the year-to-date through October 9, 2017, the WisdomTree Global ex-U.S. Real Estate Index returned 30.5% versus just an 8.6% gain for the Dow Jones Global ex-U.S. Select Real Estate Securities Index. The latter has suffered because it has heavy allotments to Japanese equities, which have generally underperformed other markets this year. Also, the MSCI Emerging Markets Index is up 30.3%, driven by the likes of China (+50.2%). In the MSCI China Index, the real estate sector itself has returned 108.9% this year. For comparison, the MSCI EAFE Index of developed market equities is up 21.4%, while its real estate exposures have returned 15.1%.
With performance disparities like this, some may expect a huge valuation gap to have opened, hindering the case for the WisdomTree Index compared to other international REIT proxies. Not exactly. Our Index closed September with a price-to-book ratio of just 1.05, a slight discount to the 1.09 P/B accorded Dow Jones’s real estate Index. Dow Jones’s fact sheet for its Index also reports an “indicated dividend yield” of 4.02%, which is below the 4.04% trailing 12-month dividend yield on the WisdomTree Index.
DRW has a track record back to June 2007 that beats its benchmark in the 1-, 3-, 5- and 10-year periods, in addition to the “since inception” time frame. It’s a way to grab global real estate exposure in an ETF wrapper. And as we saw in the comparison to the Dow Jones Global ex-U.S. Select Real Estate Securities Index, the WisdomTree Index that DRW tracks enables investors to take a truly global view because of its 26+% exposure to emerging markets. Also, for those who see global interest rates in the coming years being of the “lower for longer” variety, the WisdomTree Index’s current 4+% trailing dividend yield may prove intriguing.
As we said, REITs are the Detlef Schrempf of asset allocations: absolutely critical, overshadowed by Michael Jordan and Magic Johnson but not to be overlooked in the grand scheme of things.
1REIT: Real estate investment trust, an investment structure containing a basket of different exposures to real estate, be it directly in properties or in mortgages. Returns predominantly relate to changes in property values and income from rental payments.
2According to MSCI, there are four GICS levels. Level one encompasses the 11 sectors, with level two comprising 24 industry groups within those sectors. Level three consists of 68 industries that are inside the 24 industry groups, while level four counts 157 sub-industries.
3Source: WisdomTree, as of 9/22/17, MSCI AC World ex-US Index, as of 8/31/17.
5Source: Bloomberg.
6Source: Bloomberg, as of 9/27/17.
8Benchmark is Dow Jones Global ex-U.S. Select Real Estate Securities Index. ETF inception
Important Risks Related to this Article
There are risks associated with investing, including possible loss of principal. Foreign investing involves special risks, such as risk of loss from currency fluctuation or political or economic uncertainty. Investments in emerging, offshore or frontier markets such as the Middle East are generally less liquid and less efficient than investments in developed markets and are subject to additional risks, such as risks of adverse governmental regulation and intervention or political developments. Investments in real estate involve additional special risks, such as credit risk, interest rate fluctuations and the effect of varied economic conditions. Funds focusing their investments on certain sectors and/or smaller companies increase their vulnerability to any single economic or regulatory development. This may result in greater share price volatility. Please read the Fund’s prospectus for specific details regarding the Fund’s risk profile.
The Global Industry Classification Standard (“GICS”) was developed by and is the exclusive property and a service mark of MSCI Inc. (“MSCI”) and Standard & Poor’s (“S&P”), a division of The McGraw-Hill Companies, Inc. and is licensed for use by WisdomTree Investments, Inc. Neither MSCI, S&P nor any other party involved in making or compiling the GICS or any GICS classifications makes any express or implied warranties or representations with respect to such standard or classification (or the results to be obtained by the use thereof), and all such parties hereby expressly disclaim all warranties of originality, accuracy, completeness, merchantability and fitness for a particular purpose with respect to any such standard or classification. Without limiting any of the foregoing, in no event shall MSCI, S&P, any of their affiliates or any third party involved in making or compiling the GICS or any GICS classifications have any liability for any direct, indirect, special, punitive, consequential or any other damages (including lost profits) even if notified of the possibility of such damages.


