
Retesting Investment Anomalies with Dr. Lu Zhang


Last week’s podcast was in a new special-edition format, jointly hosted with Wesley Gray, CEO of Alpha Architect. Gray is a Philadelphia-area PhD and investment manager. He plans to join me in our Wharton School studio to help profile academic work that is most relevant to investors.
Introducing this week’s guest, Dr. Lu Zhang of Ohio State University, Gray described him as one of the world’s premiere experts on asset pricing who is examining the “factor wars” that are raging in academic circles.
Zhang and his team spent three years assembling SAS code to test 447 different investment anomalies—that is, investment strategies or investment factors found to deliver excess returns—in the finance literature to see if he could replicate the results.1
His controversial conclusion: most anomalies can’t be replicated.
The table below shows the category and number of investment strategies that Zhang tested.
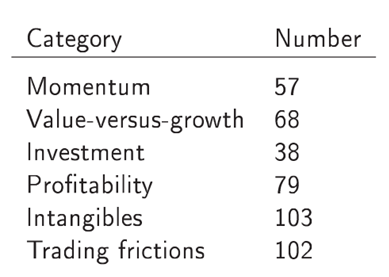
The general categories can be described like this:
1) Momentum: The tendency of stocks that are appreciating to continue to appreciate
2) Value versus growth: The tendency of stocks that have lower price multiples relative to some fundamental measure of value like book value, or earnings or dividends to show outperformance over higher multiple stocks
3) Investment: The tendency of firms that expand their assets and invest less to outperform more rapidly expanding firms
4) Profitability: The tendency of firms that have higher levels of returns on capital such as return on equity or return on assets to have higher returns than firms with lower returns on capital
5) Intangibles: The tendency of firms that have high levels of R&D or invest in branding/advertisements (i.e. high intangible value) to outperform firms with low intangible value
6) Trading frictions: The tendency of firms that have lower betas and volatility as well as less liquidity to outperform stocks with higher beta, volatility and liquidity
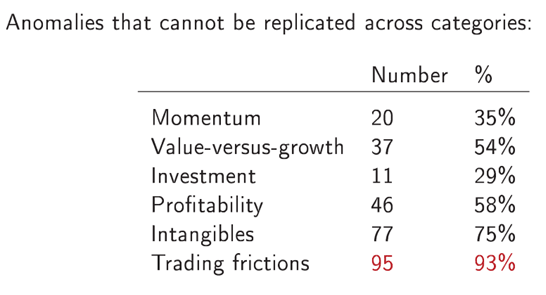
When Zhang tested these 447 academic anomalies, trading frictions (liquidity) surprised him by being the category with the highest number of academic anomalies that he could not replicate, followed by intangibles. Many of the momentum results he was able to replicate, and some of the classic value investing research also withstood his retests.
For definitions of terms in the chart, visit our glossary.
The Good and Bad News for Factor Investors
Zhang was able to replicate a number of the long-standing factor anomalies—value, momentum, profitability and the investment factor premiums. The bad news, according to Zhang, is that there are not many free lunches, and naïve investors for professional investors to take advantage of.
There are, however, real factor premiums and persistent factor premiums that Zhang believes in. His research does not suggest just to go out and buy the S&P 500—it suggests quantitative factor tilting can add to portfolio returns.
Why do these factor premiums exist? Zhang believes that no matter how many arbitrage trades are placed against these factor premiums, these factors exist in equilibrium—which is great news for quant managers who can structure portfolios to take advantage of these premiums.
The Q-Factor Model
After testing all the anomalies and seeing which ones he could replicate, Zhang wanted to explain all the results with his Q-factor model. The Q-factor model is based on the net present value rules in corporate finance.2 Let’s compare the Q-factor model to some of the other academic models being used to explain market returns. You have the original Fama and French three-factor model, which states that a portfolio’s returns can be explained by three factors:
1) MKT: The market risk premium and your beta to market risk
2) Size (SMB): How tilted to small-cap stocks the portfolio is
3) Value (HML): How tilted to value stocks the portfolio is
This original Fama and French three-factor model was later expanded to include momentum (UMD) and how exposed a portfolio is to stocks that are up versus down.
Fama and French more recently have been utilizing a five-factor model. The five factors are the original three plus the following:
4) CMA: The investment factor as described above—firms expanding assets lag firms more conservatively expanding; hence, CMA (conservative minus aggressive)
5) Robust minus weak: The RMW factor looks at firms with high returns on equity versus firms with low return on equity, a profitability factor premium
Zhang’s Q-factor model looks at:
1) The market factor
2) The size factor
3) The investment factor
4) The ROE factor
Notably absent in Zhang’s Q-factor model is the value factor. He thinks the value factor is subsumed when he includes his investment factor. Evidence: Zhang shows the five-factor model has insignificant alphas when run through his Q-factor model but the reverse is not true—the Fama and French five-factor model does not explain away the Q-factor alphas.
I will focus on this Q-factor model in greater detail in the future, as I think this foundation is important.
How to Compound Wealth High
Gray asked Dr. Zhang if he wanted to compound his wealth high for the next 20 years, of all the investment anomalies and factors he researched, what would his personal account strategy be?
Zhang replied that he would look for firms that have high returns on equity that are doing little investment. He believes that companies doing little investment have a high cost of equity, and the cost of equity is associated with expected returns going forward. Gray commented that there are few direct ways of accessing this investment strategy today.
Few strategies might incorporate the low investment screen directly; there may be good indirect ways of getting these tilts. Many indexes focus on ROE as a selection variable, and often we’ll see interaction and exposure to the low investment factor as well. We’ll explore this in future posts.
Thanks to Wes Gray for joining me as co-host on the podcast—I look forward to more joint sessions. Dr. Zhang is doing great things—I encourage you all to follow his work.
Listen to the full conversation:
1A presentation summarizing Zhang’s work can be found here.
2Dr. Zhang thinks the q-factor model applies to real economy stocks more than financial stocks, but Dr. Zhang does not think the q-factor model results would change much including financial firms.
Share & Comment
Popular Posts
Categories
Related Links
Jeremy Schwartz has served as our Global Chief Investment Officer since November 2021 and leads WisdomTree’s investment strategy team in the construction of WisdomTree’s equity Indexes, quantitative active strategies and multi-asset Model Portfolios. Jeremy joined WisdomTree in May 2005 as a Senior Analyst, adding Deputy Director of Research to his responsibilities in February 2007. He served as Director of Research from October 2008 to October 2018 and as Global Head of Research from November 2018 to November 2021. Before joining WisdomTree, he was a head research assistant for Professor Jeremy Siegel and, in 2022, became his co-author on the sixth edition of the book Stocks for the Long Run. Jeremy is also co-author of the Financial Analysts Journal paper “What Happened to the Original Stocks in the S&P 500?” He received his B.S. in economics from The Wharton School of the University of Pennsylvania and hosts the Wharton Business Radio program Behind the Markets on SiriusXM 132. Jeremy is a member of the CFA Society of Philadelphia.