Defense Mechanisms: Calling Quarter-Century Trends a Fad


This is part two of a four-part blog series addressing the attacks on smart beta and ETFs. Today we touch on the faulty argument that ETFs are a fad that creates herding, bubbles and dangerous systemic risks.
The “Fad” That Won’t Go Away
It has been more than 24 years since the launch of the first ETF, the S&P 500 Depository Receipt (SPY), and the ETF industry has been growing by leaps and bounds ever since. Yet even today, with U.S. ETF assets under management piling up to $2.5 trillion, we still contend daily with accusations that ETFs are a fad.1
Tossing the fad label around is often a psychological defense mechanism for those being displaced, because this “fad” has been taking over asset management since the first ETF came into being—and the ETF industry has its sights set on the other $16.3 trillion that is still sitting in traditional mutual funds.2
The argument that smart beta is purely a marketing scheme of sorts presupposes that there is something gimmicky about academic research. What are the core tenets of investment excellence? We assert that they include discipline, research and prudence. Creating an index that screens stocks for measures of excellence—high profitability or low valuations, and so on—is hardly faddish. Furthermore, if a fad is something that comes and goes in a flash, then the findings of Benjamin Graham and David Dodd have been a fad for 87 years.3
To say that ETFs are the cause of behavioral biases that create bubbles or market distortions is akin to saying that Internet travel websites create hotel or airline bookings. If you will be traveling to Los Angeles, you will book travel, whether the Internet exists or not.
We soon forget that ETFs are not an asset class, but an investment structure, a means of obtaining investment exposures. Smart beta is a subset of that structure, with assets under management in such strategies summing to $619 billion of the few trillion dollars in global ETF assets under management.4 For perspective, Vanguard alone manages about $4 trillion across its business,5 the bulk of which is in market cap-weighted indexes. In terms of some herding effect, it would seemingly come in the form of trillions of dollars of blind allegiance to market capitalization weighting in the halls of Vanguard and others. The distortions are not coming from value-oriented strategies like the ones designed by WisdomTree, which were built to capitalize on any inefficiencies created by the cap-weighting cattle call.
In short, players like WisdomTree are managing live money that screens out or reduces exposures to overpriced securities and companies that have deteriorating fundamentals, so we mitigate bubbles, not exacerbate them.
There Was No Herding in Energy
For all the talk of inter-asset correlations heading inexorably to 1.0, anyone long energy or materials in the last half decade hasn’t gotten the memo. In the five years through July 31, 2017, the S&P 500 returned 99.1%, while the index’s energy sector returned just 6.7%, a differential of 9,245 basis points (bps).
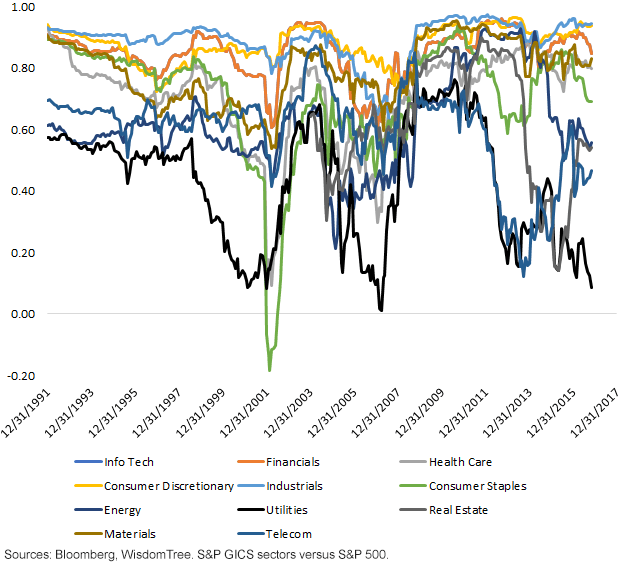
Figure 1 shows the rolling 24-month correlations between each of the 11 GICS sectors and the S&P 500. Four of them—utilities, telecom, real estate and energy—have clearly diverged from the pack, with correlations to the broad market that have broken down. Once again, if a herding effect was driving correlations to 1.0, nobody sent the memo to owners of stocks in these sectors.
Figure 1: 24-Month Correlation to S&P 500

Pushing Near-Decade Lows: Cross-Asset Correlations
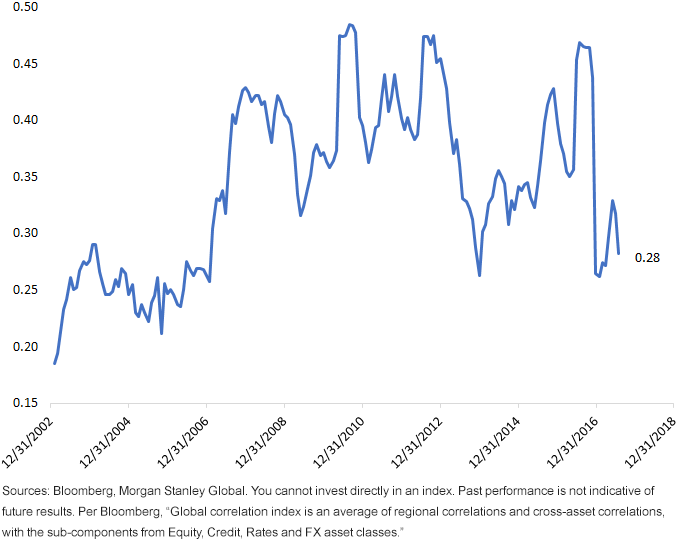
The notion that ETFs have caused inter-asset correlations to rise is also not borne out by the data. At 0.28, the Morgan Stanley Global Correlation Index is back to levels last seen nearly four years ago. Before that, inter-asset correlations were only this low more than a decade ago. This is an asset allocator’s market.
Figure 2: Morgan Stanley Global Correlation Index

Critics, Please Look in the Mirror
In modern memory, there have been four stock market crashes: the 1973–1974 bear market, the October 1987 episode, the tech meltdown from 2000–2002 and the Global Financial Crisis. ETFs either did not exist or existed only in their infancy during the buildup and collapse of those markets. With respect to dot-com, that bubble may be exceeded only by the South Sea and tulip bulb manias of prior centuries. Those two legendary bubbles, of course, happened long before the invention of both ETFs and mutual funds.
For investors who are cynical about the rise of ETFs, we ask how there can be a “bubble in ETFs” when U.S. ETF assets under management are still only $2.5 trillion, while mutual funds control $16.3 trillion?6 If a bubble exists when too much money is chasing a particular good, despite its expensive price compared to logical substitutes, then the truth is that the bubble is in mutual funds.
We believe the exponential ETF asset growth that has been seen thus far is simply testament to ETFs pricking that bubble.
1Source: 2017 Investment Company Institute Fact Book.
2Source: 2017 Investment Company Institute Fact Book.
3Source: Benjamin Graham and David Dodd, “Security Analysis,” 1930.
4Source: Ben Johnson, “Have Strategic-Beta ETFs Delivered for Investors?” Morningstar, 7/26/17. Data as of 5/17.
5Source: Vanguard, as of 12/31/16
Important Risks Related to this Article
The Global Industry Classification Standard (“GICS”) was developed by and is the exclusive property and a service mark of MSCI Inc. (“MSCI”) and Standard & Poor’s (“S&P”), a division of The McGraw-Hill Companies, Inc., and is licensed for use by WisdomTree Investments, Inc. Neither MSCI, S&P nor any other party involved in making or compiling the GICS or any GICS classifications makes any express or implied warranties or representations with respect to such standard or classification (or the results to be obtained by the use thereof), and all such parties hereby expressly disclaim all warranties of originality, accuracy, completeness, merchantability and fitness for a particular purpose with respect to any such standard or classification. Without limiting any of the foregoing, in no event shall MSCI, S&P, any of their affiliates or any third party involved in making or compiling the GICS or any GICS classifications have any liability for any direct, indirect, special, punitive, consequential or any other damages (including lost profits), even if notified of the possibility of such damages.


