Active Share: Measure Stock Picking among Your Strategies


Active share is a seldom-used statistic, but don’t be mistaken—it’s an important one. For equity funds, it measures how “alike” a strategy is to its benchmark based on the stocks selected and the weights assigned to them. Thus, 0% active share means stocks and weights are identical, while 100% active share means there is nothing in common between the strategy and its benchmark.

Generally used in the mutual fund world, active share informs an investor how much active stock picking a manager is making versus a benchmark. When evaluating how “active” an active manager actually is, the fees and corresponding hurdle rate are important considerations:
1)Fees: For their services, active managers tend to charge relatively higher fees compared to index-based exposures, so not only do investors rely on their decision-making ability to beat beta benchmarks but investors are also implicilty betting that active managers are making enough decisions to give themselves a chance to outperform, given their fees.
2)Hurdle Rate:1 The hurdle rate considers the relatively higher fees charged by active managers and the lower fees that would be charged for the comparable beta exposure, and then calculates what level of outperformance the active managers would need to achieve (with their active share component) to at least match the benchmark.
Below, we frame fees, active share and the hurdle rate to better understand how they impact expectations.

- Example Fund A is expensive at 1.05% per year and also carries a low active share of only 15%. This means 85% of the fund is the same as the S&P 500 Index and won’t contribute to outperformance, leaving only 15% room to beat beta. Because the high fees of Example Fund A act as a headwind, it must outperform the S&P 500 by 6.73% a year with its 15% active share in order to break even with the market. That’s a high hurdle.
- Example Fund B charges the same expense ratio as Example Fund A, but it has a much larger active share of 75%. This lowers its hurdle rate considerably as the manager now has more room to impact the fund’s final returns relative to the S&P 500. Example Fund B’s active manager has to beat the S&P 500 by 1.35% with 75% active share. A smaller hurdle than Example Fund A, but a formidable hurdle nonetheless.
- Example Fund C has a lower expense ratio and a higher active share. This makes the hurdle rate a meer 32 basis points (bps). In other words, by lowering the fees and increasing active share, Example Fund C removes its handicap as much as possible.This allows its stock picking, if successful, to impact the fund in a more meaningful way.
With Example Fund C, you are betting that the portion of the fund that the active manager can affect will account for at least 32 bps of outperformance per year. This may seem a reasonable hurdle for an active manager to clear, but the fee of .28% is somewhat unrealistic. In fact, WisdomTree found that the Morningstar mutual fund large-blend category has a median expense ratio of .95%; and that is including the index mutual funds that don’t rely on active decision making. Were we to remove those low-fee, index-tracking mutual funds, that number may easily gravitate north of 1.00%. Fees are one reason why 88%, 90% and 97% of large-cap, mid-cap and small-cap active managers underperfomed the S&P 500, S&P MidCap 400 and S&P SmallCap 600 indexes, respectively, over the last five years.2
To be clear, higher active share does increase a fund’s ability to underperform beta and to have potentially higher tracking error. But those on the quest for alpha should have at least some active share in order to attain it. The more important question is: “How does one find intelligent high active share for a low cost?” Our answer: a passive multifactor approach.
WisdomTree U.S. Multifactor Fund (USMF)
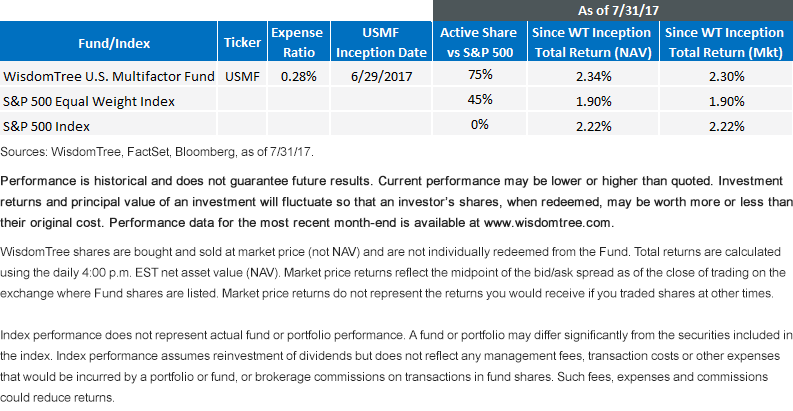
In the case of the WisdomTree U.S. Multifactor Fund, by eliminating the active manager and using a passive, rules-based approach, one is able to lower the expense ratio to .28%, considerably less than the median fees of active management. As of July 31, 2017, the fund’s active share was 75% versus the S&P 500, resulting in its fees and active share being the same as Example Fund C from earlier, implying a hurdle rate of only 32 bps.
This high active share component comes from selecting 200 stocks that exhibit the highest composite attributes of value, quality, low correlation and momentum, which are all factors associated with generating excess returns versus the market over long-term holding periods. This is all done while remaining sector neutral to the market, making your potential alpha not a sector bet but a focused multifactor selection and weighting bet.
Although the WisdomTree U.S. Multifactor Fund’s inception date was just a month ago, we have already begun to see outperformance. We are excited by the potential of a multifactor approach with such a low hurdle rate and look forward to following it in the coming years.

Click here for USMF standardized performance.
1Martijn Cremers, “Active Share and the Three Pillars of Active Management: Skill, Conviction and Opportunity,” 12/28/16. Will appear in a forthcoming issue of Financial Analysts Journal. Available at SSRN: https://ssrn.com/abstract=2860356 or http://dx.doi.org/10.2139/ssrn.2860356
2SPIVA Year-End U.S. Scorecard, as of 12/30/16.
Important Risks Related to this Article
There are risks associated with investing, including possible loss of principal. Investing in a Fund exposed to particular sectors increases the vulnerability to any single economic, political or regulatory development. This may result in greater share price volatility. Due to the investment strategy of the Fund, it may make higher capital gain distributions than other ETFs. Please read the Fund’s prospectus for specific details regarding the Fund’s risk profile.
