Strong Buy Signal: EM Valuation Gap vs. S&P 500


Given several years of diverging returns between U.S. and emerging market (EM) equities, it should come as no surprise that EM equities currently trade at a discount to U.S. equities. The size of that discount, however, is something that we feel is not being fully appreciated by many investors.
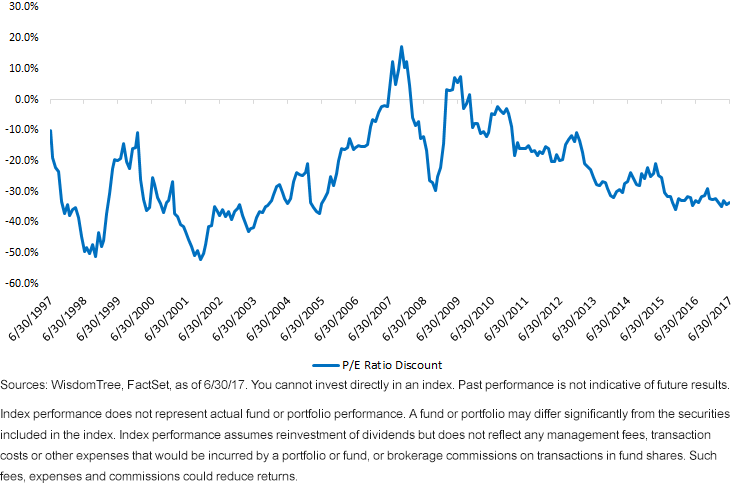
As of June 30, the MSCI Emerging Markets Index traded at a 14.6x price-to-earnings (P/E) ratio, while the S&P 500 Index was at 21.9x earnings—a 33.5% discount.1 This is one of the largest valuation gaps between the two gauges since 2005.
MSCI EM Index P/E Ratio Discount to S&P 500

Remember the Last Time This Happened?
Investors who allocated to EM in 2005 likely recall those days fondly. Starting in 2005, the MSCI EM Index began a three-year stretch of returning at least 32% per year—significantly higher than the 28.2% cumulative return provided by the S&P 500 over that same time.2
Surely hindsight is 20/20, but if investors had known then what they know now, odds are they would have taken advantage of the valuation opportunity presented to them by backing up the truck and buying EM in droves.
Fortunately for investors who missed the opportunity in 2005, they may be in luck right now.
Historical Precedent of Outperformance
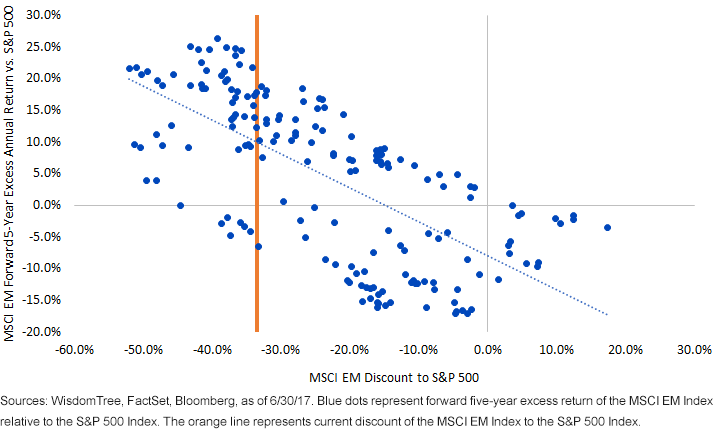
On a monthly basis over the last 20 years, there have been 61 instances where the valuation gap between the MSCI EM Index and the S&P 500 has been as large as it currently stands. Following these instances, the next several years have tended to provide stellar returns for EM investors:
- 89% of the time, the MSCI EM Index outperformed the S&P 500 over the next five years (54 of 61 instances)
- Average five-year annual return for the MSCI EM Index was 18.7%
- Average five-year annual return for S&P 500 was 3.9%
MSCI EM Index P/E Discount to S&P 500 and Forward 5-Year Excess Annual Return vs. S&P 500

Don’t Forget the Other Part of P/E
Granted, valuation alone is not a catalyst, but a significant one is just picking up steam. Corporate earnings in EM collapsed starting in 2011, bottomed out at the start of 2016 and finally turned positive at the start of 2017. Given the long-awaited delivery of earnings growth (and with forward earnings expectations rapidly rising3), we believe that this could help keep EM valuations relatively low, even if stock prices continue to rally.
The EM rally that began in 2016 is still getting its legs underneath it, and investors worrying that they missed the opportunity should fear not. We believe that strategic investors with longer investment horizons should be taking advantage of any opportunity to add to their EM allocations.
Smart Beta ETFs to Access the Rally
With a strong case for the asset class behind us, the next step is how to implement. WisdomTree has two of the largest exchange-traded funds (ETFs) in the industry in the WisdomTree Emerging Markets SmallCap Dividend Fund (DGS) and the WisdomTree Emerging Markets High Dividend Fund (DEM). Both of these ETFs have strong track records over the nine-plus years of their history: DGS, which is the largest small-cap EM ETF in the industry and launched in October 2007, and DEM, a value-oriented fund that just passed its 10-year anniversary. In addition to these, we wanted to bring attention to two lesser-known core smart beta offerings.
One of the best-performing broad-based EM ETFs in the first half of 2017 was the WisdomTree Emerging Markets ex-State-Owned Enterprises Fund (XSOE), finishing up 22.8% against the MSCI EM Index’s 18.4%.4 The Fund’s methodology enables it to reduce exposure to state-owned companies, and as a result tends to be over-weight in the “new” EM sectors such as Technology and Consumer Discretionary. The Fund’s positions in these two growth sectors have provided momentum-style excess returns for the Fund in 2017 and since its inception in 2014.
On the flip side, the WisdomTree Emerging Markets Dividend Fund (DVEM) tends to be more of a value-oriented strategy. DVEM includes all dividend-paying stocks in the EM universe and weights them by their contribution to the Dividend Stream®. This methodology typically means that the Fund will trade at a discount to, and have less volatility than, the overall market. While value has been out of favor across the globe in 2017, we believe that the value factor certainly exists in EM and may see a return to prominence in the near future.
Conclusion
Smart beta adoption has taken ahold of U.S. markets and has started to bleed into international developed markets. With a historical valuation opportunity facing investors today in EM, we think there’s a valid case to be made for smart beta offerings there as well. Momentum-focused investors can see that XSOE has added value since its inception, and those of a value mindset will find DVEM at an even more attractive relative valuation than an already attractive EM index. Depending on which particular factor an investor believes has the best potential to outperform, WisdomTree can provide a core solution.
1FactSet, as of 6/30/17.
2Bloomberg, as of 6/30/17.
3Bloomberg, as of 6/30/17.
4Morningstar Direct, as of 6/30/17.
Important Risks Related to this Article
There are risks associated with investing, including possible loss of principal. Foreign investing involves special risks, such as risk of loss from currency fluctuation or political or economic uncertainty. Funds focusing on a single sector and/or smaller companies generally experience greater price volatility. Investments in emerging, offshore or frontier markets are generally less liquid and less efficient than investments in developed markets and are subject to additional risks, such as risks of adverse governmental regulation, intervention and political developments.
Heightened sector exposure increases the Fund’s vulnerability to any single economic, regulatory or other development impacting that sector. This may result in greater share price volatility. The Funds invests in the securities included in, or representative of, its Index regardless of their investment merit, and the FundS does not attempt to outperform its Index or take defensive positions in declining markets. Due to the investment strategy of this Fund, it may make higher capital gain distributions than other ETFs. Please read the Fund’s prospectus for specific details regarding the Fund’s risk profile.
Investments in currency involve additional special risks, such as credit risk and interest rate fluctuations.
Due to the investment strategy of these Funds it may make higher capital gain distributions than other ETFs. Please read the Funds’ prospectuses for specific details regarding the Funds’ risk profile.
The MSCI information may only be used for your internal use, may not be reproduced or redisseminated in any form and may not be used as a basis for or component of any financial instruments or products or indexes. None of the MSCI information is intended to constitute investment advice or a recommendation to make (or refrain from making) any kind of investment decision and may not be relied on as such. Historical data and analysis should not be taken as an indication or guarantee of any future performance analysis, forecast or prediction. The MSCI information is provided on an “as is” basis and the user of this information assumes the entire risk of any use made of this information. MSCI, each of its affiliates and each entity involved in compiling, computing or creating any MSCI information (collectively, the “MSCI Parties”) expressly disclaims all warranties. With respect to this information, in no event shall any MSCI Party have any liability for any direct, indirect, special, incidental, punitive, consequential (including loss profits) or any other damages. (www.msci.com)
The Global Industry Classification Standard (“GICS”) was developed by and is the exclusive property and a service mark of MSCI Inc. (“MSCI”) and Standard & Poor’s (“S&P”), a division of The McGraw-Hill Companies, Inc. and is licensed for use by WisdomTree Investments, Inc. Neither MSCI, S&P nor any other party involved in making or compiling the GICS or any GICS classifications makes any express or implied warranties or representations with respect to such standard or classification (or the results to be obtained by the use thereof), and all such parties hereby expressly disclaim all warranties of originality, accuracy, completeness, merchantability and fitness for a particular purpose with respect to any such standard or classification. Without limiting any of the foregoing, in no event shall MSCI, S&P, any of their affiliates or any third party involved in making or compiling the GICS or any GICS classifications have any liability for any direct, indirect, special, punitive, consequential or any other damages (including lost profits) even if notified of the possibility of such damages.


