The WisdomTree Earnings 500: T-Rexing Money Management’s Accident of History


EPS: The Answer to Our Industry’s Secret “Oops”
The WisdomTree Earnings 500 ETF (EPS) was launched February 23, 2007, with a clearly defined thought process: tracking an Index weighted by a fundamental factor such as earnings could be the way to go.
What was the impetus for the S&P 500 Index’s market capitalization-weighted design—which gives the largest companies the highest weights—when it took its current form in 1957?1 Was the index created in response to rigorous academic study or was it, troublingly, an accident? You decide.
Malkiel’s Citations: Confirming the Accident of History
The efficient market hypothesis (EMH), a beaten-down concept that says that all known information is already baked into asset prices, came along after the birth of the S&P 500. Say what?
The simpleton index had to be naive, because there were no computers, no WisdomTree-style fundamental equity screens in 1957. Some guy probably needed to do a calculation based on his own slogging through hundreds of paper-based annual reports, then sit down with a pen and paper to work out the arithmetic. Now, trillions of dollars of real money tracks that index.
Think about this: In 2003, legendary professor Burton Malkiel, author of the 1973 classic A Random Walk down Wall Street, penned “The Efficient Market Hypothesis and Its Critics2.” The 47-page research paper cited 57 classic studies for and against the EMH. The only pre-1957 reference was to anti-EMH Graham & Dodd, the founding fathers of deep value investing.
The S&P 500’s legend as a deeply thought-out index is an illusion, an accident, and today it stands as the benchmark almost solely because it was the first index of its kind.
Jeremy Siegel & Ken French vs. S&P’s Summer Intern
Consider work by Wharton Professor Jeremy Siegel, who concluded that the 20% of stocks with the lowest price-to-earnings (P/E) ratio returned 12.9% per year from 1957 to 2016, generating alpha of 249 basis points (bps) per annum over the S&P.3
And this:
We navigated through Kenneth French’s data library4 to analyze performance since 1957. Like Siegel’s study, French breaks the market5 into five quintiles based on earnings yield. Companies with negative earnings are excluded and the research encompasses all NYSE, AMEX and NASDAQ stocks for which French has data.
The highest earnings-to-price quintile (the least expensive, synonymous with the lowest P/E ratio quintile) returned 15.13% annually for 59 years, 463 bps more than the total market (see below). It did this with only a slightly higher standard deviation (16.54% vs. 15.06%).
Long-Term Performance, Portfolios Formed Using Earnings-to-Price Ratio
December 31, 1957 to December 31, 2016

One dollar invested in the total market would have grown to $361, while the highest earnings-to-price quintile would have multiplied more than 4,000-fold.
Meanwhile, the S&P 500 is still here, maybe courtesy of a class of ’57 interns.
A New Benchmark
We believe the WisdomTree Earnings 500 Index, with its more than 10-year track record, is the “new S&P 500,” because its Earnings Stream methodology taps into concepts that make the Siegel and French studies compelling.
Rather than going the S&P 500 route and blindly buying stocks because they have large market capitalizations and could be expensive, companies are instead weighted by their earnings. If all companies together earn $1 trillion and one of them earns $30 billion, it is 3% of the Index—logical.
Rationally, this creates a tilt to lower P/E ratios and thus the value factor.
The WisdomTree Earnings 500 through the Years
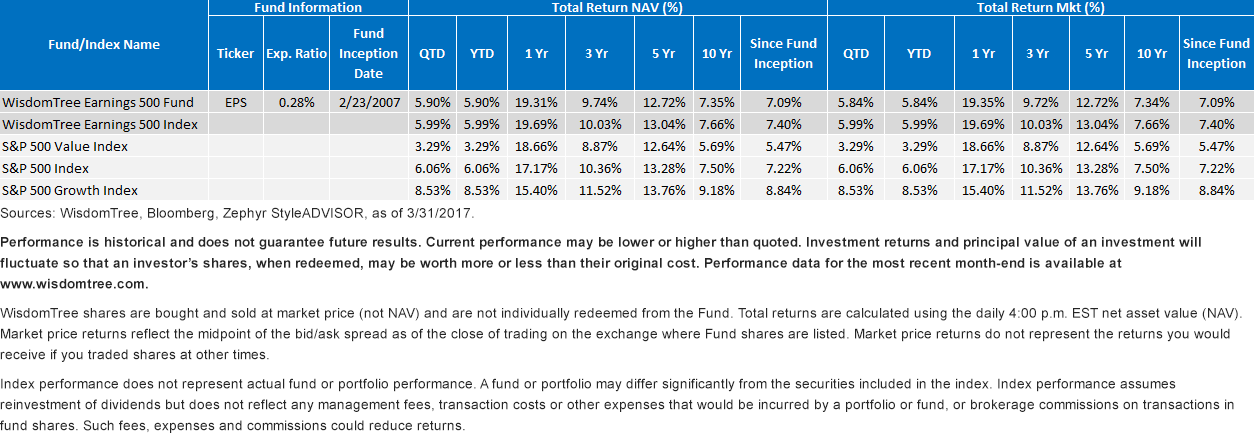
Despite the S&P 500 Growth Index outperforming the S&P 500 Value Index by 337 bps from February 23, 2007, to March 31, 2017 (the life of EPS, the WisdomTree Earnings 500 Fund), our ETF actually managed to come within 13 bps of the S&P 500 Index during that time horizon despite the considerable value factor headwind.
This is fascinating because EPS is designed to track the price and yield performance before fees and expenses of the WisdomTree Earnings 500 Index, an Index that naturally tilts toward low P/E stocks, and yet EPS returned 162 bps more per year than the S&P 500 Value Index since its launch in 2007.
Average Annual Returns of EPS

Newman!
Remember the Jurassic Park scene with Seinfeld’s “Newman” sitting in the car, freaking out when the cup of water starts shaking? You can feel the T-Rex.
A lot of vested interests depend on blind allegiance to the S&P 500 Index, but the clock is ticking on that historical accident. WisdomTree has a live 10-year track record on a large-cap core Index that outperformed the S&P 500 Index—and we believe in its potential to be here in year 15 and year 20 and so on. What happens if the value factor comes into favor?
At one of these anniversaries the WisdomTree Earnings 500 Index may not be “smart” beta anymore; it may just be beta. New beta. We think it’s time to replace what we see as our industry’s accident of history.
In 2007 WisdomTree was a baby T-Rex cracking out of its shell. Now, the adult T-Rex is peering through the windshield. Newman, run for the hills!
1The S&P 500 Index began its live calculation March 4, 1957.
2Burton Malkiel, “The Efficient Market Hypothesis and Its Critics,” Journal of Economic Perspectives (17(1):59-82), February 2003.
3Source: Wharton Professor Jeremy Siegel, Senior Strategy Advisor to WisdomTree, The future For Investors, originally published in 2005; updated in 2016.
4http://mba.tuck.dartmouth.edu/pages/faculty/ken.french/Data_Library/det_port_form_ep.html
5The “market” refers to all publicly listed U.S. equities with available pricing and necessary fundamental data.
Important Risks Related to this Article
There are risks associated with investing, including possible loss of principal. Funds focusing their investments on certain sectors increase their vulnerability to any single economic or regulatory development. This may result in greater share price volatility. Please read the Fund’s prospectus for specific details regarding the Fund’s risk profile.


