Emerging Market ETF Flows Concentrated in 2016—but Not at the Top


2016 marked a remarkable turnaround for emerging markets (EM) equities. Following three consecutive years of negative performance, the MSCI Emerging Markets Index returned 11.2%1 in 2016, which was its best annual performance since 2012.
Behavioral finance has proven that flows tend to chase performance, and in 2016, EM equities were no exception to the rule. Looking at both the broad market as well as individual country funds, EM stock exchange-traded funds (ETFs) took in $18.034 billion in 2016, an incredible number for an asset class that had seen only one year of inflows since 2012.2
However, not all EM ETFs were beneficiaries of these flows, as digging past the headline number reveals an interesting story.
Flows Return, but Only to a Handful of Funds
Of the flows that went into EM stock ETFs in 2016, three ETFs took in the vast majority of the money. In fact, these three funds collectively brought in $17.3 billion of the $18 billion total inflow—accounting for more than 95% of the total flows of the entire asset class!3
These three ETFs are among the largest in the EM universe, based on their current assets under management. It stands to reason that larger funds beget larger flows, but the sheer percentage of flow concentration is certainly a sight to behold.
Did Flows Correlate to Relative Performance?
Normally, when flows seem magnetized to such a small number of funds, rational observers may assume the reason behind that phenomenon is because these specific strategies have trailing performance near the top of their peer group. However, that was hardly the case for these three ETFs. In fact, the indexes currently tracked by two of the ETFs that took in the most inflows in 2016 both trailed the MSCI Emerging Markets Index (the index that is tracked by the third ETF)
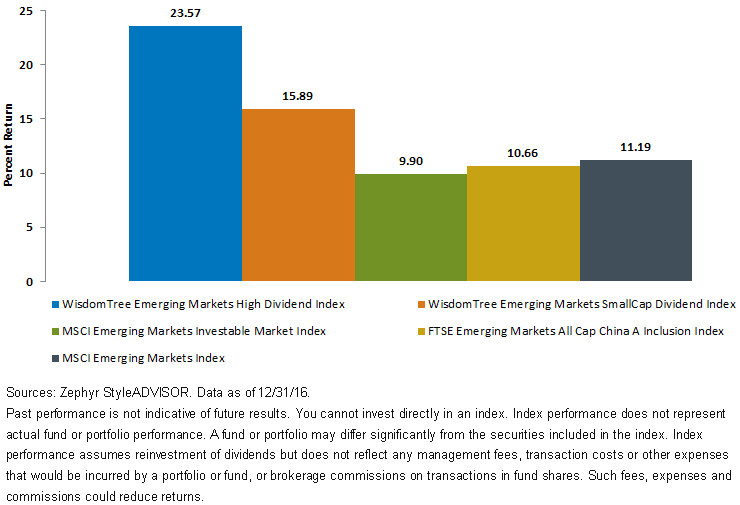
On the flip side, two of WisdomTree’s longest-tenured diversified EM Indexes, the WisdomTree Emerging Markets High Dividend Index (WTEMHY) and the WisdomTree Emerging Markets SmallCap Dividend Index (WTEMSC), each outperformed the MSCI EM index by at least 4.7%, landing them both in the upper echelon of emerging markets strategies in 2016.
2016 Performance

For definitions of indexes in the chart visit our glossary.

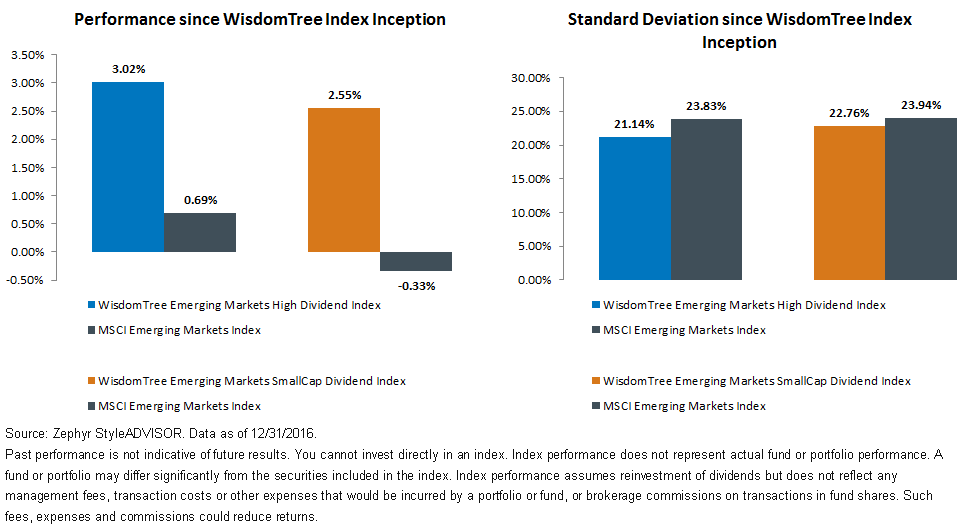
We believe emerging markets investors should look beyond the largest handful of EM strategies to those with the strongest long-term risk-adjusted numbers.
1Zephyr StyleADVISOR.
2Bloomberg, 1/3/17.
3Bloomberg.
4StyleADVISOR.
5Zephyr StyleADVISOR.
6Zephyr StyleADVISOR. WisdomTree Emerging Markets High Dividend Index performance and standard deviation measured from 6/1/07 to 12/31/16. WisdomTree Emerging Markets SmallCap Dividend Index performance and standard deviation measured from 8/1/2007 to 12/31/2016.
Important Risks Related to this Article
Investments in emerging, offshore or frontier markets are generally less liquid and less efficient than investments in developed markets and are subject to additional risks, such as risks of adverse governmental regulation and intervention or political developments.

