
Tech vs. Utilities: Which Is a Better Income Strategy?


Ten years ago, the idea that I would be writing a research article about how technology stocks should be considered as part of an income-oriented investment strategy seemed rather implausible.
When WisdomTree’s dividend-weighted Indexes launched in 2006, technology stocks, despite being the second largest sector in the S&P 500 Index by market cap at the time, at around 15% weight, represented only a small subset of dividends paid in the U.S.
Utilities, which made up the third smallest sector by weight in a market cap index, at around only 3%, contributed a greater amount of total dividends among large-cap companies than tech companies did.1
But the Information Technology sector has changed. The fastest growth in total dividends being paid from any sector in the last 10 years came from the technology sector, and now the single largest sector in the WisdomTree LargeCap Dividend Index—which allocates weight according to total dividends indicated to be paid—is the tech sector.
Companies like Apple, Microsoft, Cisco, Intel and IBM are among the 20 largest dividend payers in the U.S.2
With Growing Dividends Come Growing Dividend Yields
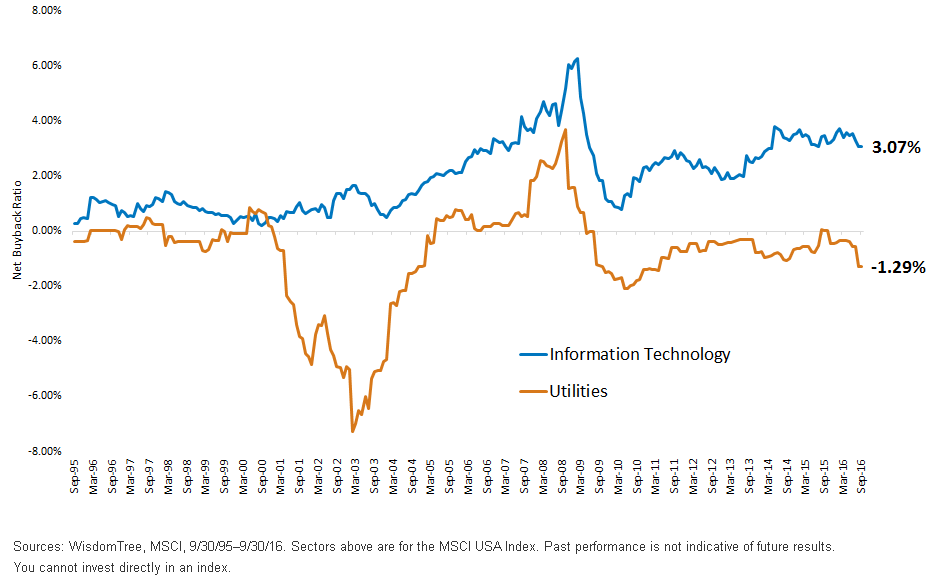
Technology companies have also been known for conducting stock buybacks. In finance theory, if a company has 100 shares outstanding and conducts a 3% stock buyback, so that it reduces its shares outstanding to 97, the future earnings per share and dividends per share of the company increase, without any changes in the ultimate earnings or dividends the firm is paying in aggregate. The important number is the net buybacks that account for share count issuance—let’s say from stock options.
Dividends Plus Buybacks: The Edge Increasingly Goes to Technology
If we look back 20 years, in the mid- to late 1990s, there was no question which sector was a preferred income strategy: Tech companies paid few dividends and conducted minimal amounts of net stock buybacks. Utilities in 1995 had a more than 5% total shareholder yield edge over technology companies.
What is interesting is how the Utilities sector’s total shareholder yield over last 20 years has displayed a few distinct trends where companies were issuing shares to fund their growth/dividends from the late 1990s to 2003, and there was actually a negative net total shareholder yield given a lot of share issuance.
Tech companies, on the other hand, have largely been growing both their dividends and their buybacks, so we have seen a generally rising total shareholder yield distribution.
Shareholder Yield: Dividend Yield Plus Net Buyback Ratio
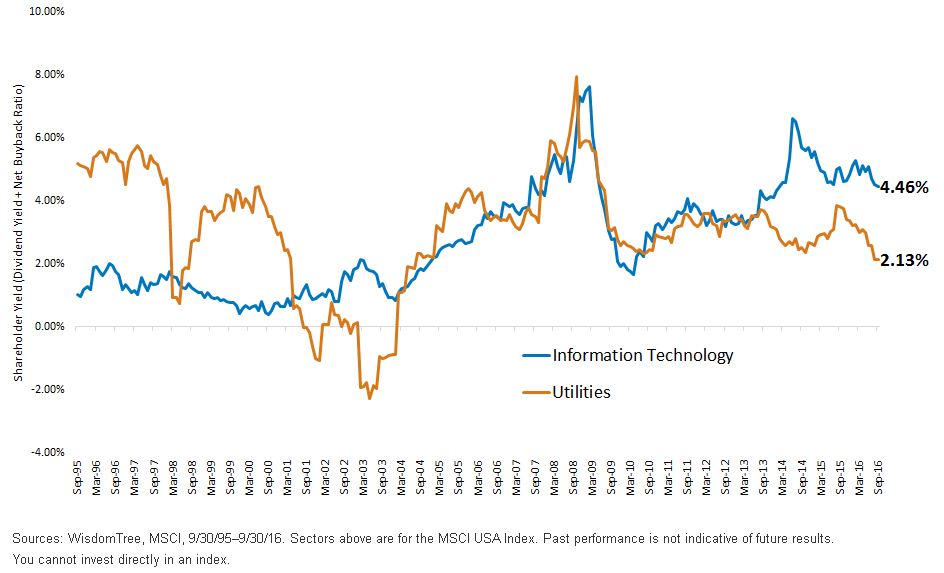
Total Shareholder Yields Rose Together, Then Diverged
From 2004 to 2009, the total shareholder yields of the Utilities sector and tech companies were generally rising together, and they both peaked in total shareholder yields close to 8% during the financial crisis with prices declining.
But in the last three years there has been an interesting divergence: Utilities have seen their total shareholder yields decline and approach 2%, given a negative net buyback yield (meaning these Utilities are issuing shares), while technology companies have seen more robust growth in total distributions.
Net Buyback Ratio
While Utilities have been in favor given their dividend levels and people have traditionally looked to Utilities for income, the tech sector has been growing both its dividends and its net buybacks.
In a previous blog post, we discussed why we thought the WisdomTree U.S. Quality Dividend Growth Index was a preferred strategy from a valuation perspective over a high-dividend index that is concentrated in Utilities, such as the Dow Jones U.S. Select Dividend Index.
While technology stocks are not known for their income attributes, the trends are clearly illustrating that they are growing both dividends and buybacks, and Utilities, while being one of the higher-dividend sectors, are doing share issuance that is diluting some of these dividends, making future dividend growth harder to come by. The WisdomTree U.S. Quality Dividend Growth Index has a top exposure in technology stocks, and the trends discussed here help explain why we see this as a preferred income- oriented strategy.
1Sources: WisdomTree, Bloomberg, as of 5/31/06.
2For current holdings of the WisdomTree LargeCap Dividend Index, click here.
Important Risks Related to this Article
Dividends are not guaranteed, and a company currently paying dividends may cease paying dividends at any time.Investments focusing on certain sectors and/or smaller companies increase their vulnerability to any single economic or regulatory development. This may result in greater share price volatility.
Share & Comment
Popular Posts
Categories
Related Links
Jeremy Schwartz has served as our Global Chief Investment Officer since November 2021 and leads WisdomTree’s investment strategy team in the construction of WisdomTree’s equity Indexes, quantitative active strategies and multi-asset Model Portfolios. Jeremy joined WisdomTree in May 2005 as a Senior Analyst, adding Deputy Director of Research to his responsibilities in February 2007. He served as Director of Research from October 2008 to October 2018 and as Global Head of Research from November 2018 to November 2021. Before joining WisdomTree, he was a head research assistant for Professor Jeremy Siegel and, in 2022, became his co-author on the sixth edition of the book Stocks for the Long Run. Jeremy is also co-author of the Financial Analysts Journal paper “What Happened to the Original Stocks in the S&P 500?” He received his B.S. in economics from The Wharton School of the University of Pennsylvania and hosts the Wharton Business Radio program Behind the Markets on SiriusXM 132. Jeremy is a member of the CFA Society of Philadelphia.