Is Now the Time to Consider Long/Short Alternatives?


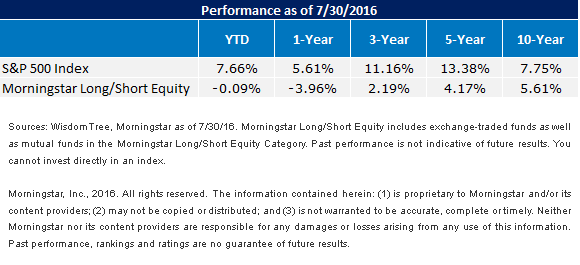
 The disappointing returns for the category cited above do not refute the role or stated goal for these strategies. With stock markets and bond markets at all-time highs, investors are perhaps appropriately looking for solutions that can help lower portfolio volatility and navigate adverse moves in the market.
But does one need to rely on an active approach, which typically carries higher fees and therefore higher hurdle rates?
A Systematic, Exchange-Traded Fund (ETF) Approach to Long/Short Investing
Late last year, WisdomTree launched a long/short equity Fund in the ETF structure. Our thought process: we saw the high fees in traditional active long/short strategies and wanted to build a rules-based systematic ETF that attempts to deliver value through both stock selection and a dynamic hedging of market risk at a low cost2 for this category, with the expense ratio of 0.48%. We believe the WisdomTree Dynamic Long/Short Equity Fund (DYLS) could currently be one of the lowest-cost funds in the long/short equity category.
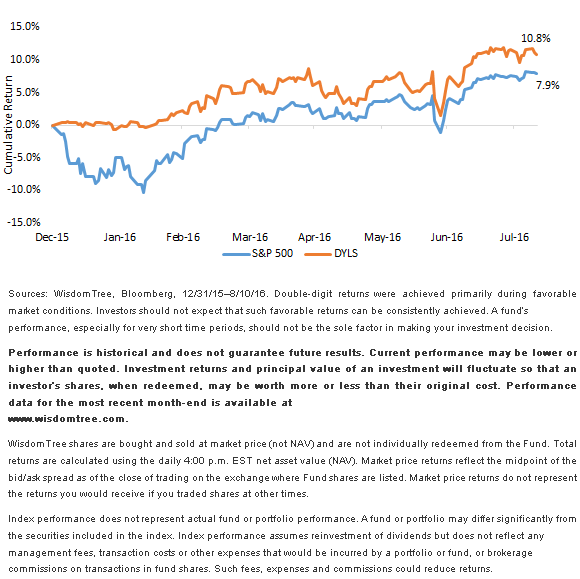
In what has been a difficult environment for the traditional long/short equity funds this year—with performance of the average long/short fund showing negative returns in 2016—DYLS has had returns over 10% through August 10, 2016, while the S&P 500 was up approximately 8%. For standardized performance of DYLS, visit the WisdomTree Dynamic Long/Short Equity Fund page.
DYLS vs. S&P 500 YTD
 Quality and Value Selection, with No Inherent Sector Bets
DYLS implements a stock selection strategy that incorporates a value and quality discipline to forming the portfolio. One of the features of its underlying Index methodology, though, is a sector-neutral starting point and sector-driven stock selection strategy.
Despite employing a strategy that selects stocks selling at relatively lower price multiples with higher-quality characteristics, the incorporation of a sector-neutral weighting scheme leaves no inherent sector bets being made in DYLS.
This sector neutrality mitigates the risk from value stocks or quality stocks falling out of favor in a given market cycle and really focuses on the value-added side of the value/quality factors for picking stocks. We also believe that employing unique models for every sector helps differentiate this strategy from other “smart beta” funds, which typically look at quality or value stocks using a single framework across all stocks. Further, within each sector, there is a low-volatility weighting emphasis.
How Dynamic Hedging Could Have Helped Protect a Portfolio in Early 2016
In the chart above on performance in 2016, one can see DYLS had a relatively flat performance in January and February, while the market swooned 10% and then rallied back in March. DYLS uses a dynamic hedging indicator that was fully hedged for January and February, and the hedge came off on March 2. The full market hedge in DYLS that was incorporated in January and February has been a key differentiator for its performance. The indicators we use have remained unhedged since March, so DYLS has participated in the market’s gains since March 2.
The dynamic hedging process employed by DYLS looks at trends in underlying profit margins and quality of profits, combined with overall market valuations. The model for hedging is completely rules-based. When our fundamental indicators show more risk building up in the market, a hedge will be put back in place. Given the indicator is based on trends in profits and valuations, it is certainly possible for a hedge to come back in place. This should help lower overall volatility compared to “vanilla” long-equity strategies but probably has a slightly higher overall equity market exposure than the typical long/short fund in the active space, in our view.
While the period is quite limited, with less than one year of real-time performance results, our hedging indicator has coincided quite accurately with market performance in 2016, giving a nice start to DYLS. In a year marked by disappointing performance for many long/short active strategies, investors may consider a relatively low-cost ETF option like DYLS.
1William Baldwin, “Scary Results At Long-Short Equity Funds,” Forbes, 8/23/16.
2Ordinary brokerage commissions apply.
Quality and Value Selection, with No Inherent Sector Bets
DYLS implements a stock selection strategy that incorporates a value and quality discipline to forming the portfolio. One of the features of its underlying Index methodology, though, is a sector-neutral starting point and sector-driven stock selection strategy.
Despite employing a strategy that selects stocks selling at relatively lower price multiples with higher-quality characteristics, the incorporation of a sector-neutral weighting scheme leaves no inherent sector bets being made in DYLS.
This sector neutrality mitigates the risk from value stocks or quality stocks falling out of favor in a given market cycle and really focuses on the value-added side of the value/quality factors for picking stocks. We also believe that employing unique models for every sector helps differentiate this strategy from other “smart beta” funds, which typically look at quality or value stocks using a single framework across all stocks. Further, within each sector, there is a low-volatility weighting emphasis.
How Dynamic Hedging Could Have Helped Protect a Portfolio in Early 2016
In the chart above on performance in 2016, one can see DYLS had a relatively flat performance in January and February, while the market swooned 10% and then rallied back in March. DYLS uses a dynamic hedging indicator that was fully hedged for January and February, and the hedge came off on March 2. The full market hedge in DYLS that was incorporated in January and February has been a key differentiator for its performance. The indicators we use have remained unhedged since March, so DYLS has participated in the market’s gains since March 2.
The dynamic hedging process employed by DYLS looks at trends in underlying profit margins and quality of profits, combined with overall market valuations. The model for hedging is completely rules-based. When our fundamental indicators show more risk building up in the market, a hedge will be put back in place. Given the indicator is based on trends in profits and valuations, it is certainly possible for a hedge to come back in place. This should help lower overall volatility compared to “vanilla” long-equity strategies but probably has a slightly higher overall equity market exposure than the typical long/short fund in the active space, in our view.
While the period is quite limited, with less than one year of real-time performance results, our hedging indicator has coincided quite accurately with market performance in 2016, giving a nice start to DYLS. In a year marked by disappointing performance for many long/short active strategies, investors may consider a relatively low-cost ETF option like DYLS.
1William Baldwin, “Scary Results At Long-Short Equity Funds,” Forbes, 8/23/16.
2Ordinary brokerage commissions apply.Important Risks Related to this Article
There are risks associated with investing, including possible loss of principal. The Fund invests in derivatives, including as a substitute to gain short exposure to equity securities. Derivative investments can be volatile, and these investments may be less liquid than other securities, and more sensitive to the effects of varied economic conditions. Derivatives used by the Fund to offset its exposure to market volatility may not perform as intended. The Fund may engage in “short sale” transactions and will lose value if the security or instrument that is the subject of a short sale increases in value. A Fund that has exposure to one or more sectors may increase the Fund’s vulnerability to any single economic or regulatory development. This may result in greater share price volatility. The composition of the Index is heavily dependent on quantitative models and data from one or more third parties, and the Index may not perform as intended. The Fund invests in the securities included in, or representative of, its Index regardless of their investment merit, and the Fund does not attempt to outperform its Index or take defensive positions in declining markets. Please read the Fund’s prospectus for specific details regarding the Fund’s risk profile.
Past performance is not indicative of future results.

Jeremy Schwartz has served as our Global Chief Investment Officer since November 2021 and leads WisdomTree’s investment strategy team in the construction of WisdomTree’s equity Indexes, quantitative active strategies and multi-asset Model Portfolios. Jeremy joined WisdomTree in May 2005 as a Senior Analyst, adding Deputy Director of Research to his responsibilities in February 2007. He served as Director of Research from October 2008 to October 2018 and as Global Head of Research from November 2018 to November 2021. Before joining WisdomTree, he was a head research assistant for Professor Jeremy Siegel and, in 2022, became his co-author on the sixth edition of the book Stocks for the Long Run. Jeremy is also co-author of the Financial Analysts Journal paper “What Happened to the Original Stocks in the S&P 500?” He received his B.S. in economics from The Wharton School of the University of Pennsylvania and hosts the Wharton Business Radio program Behind the Markets on SiriusXM 132. Jeremy is a member of the CFA Society of Philadelphia.

