
The Price You Pay


08/03/2016
The last month or so has certainly given the money and bond markets a lot of divergent news headlines to digest. Not surprisingly, the focus has been on negative rates abroad, geopolitical events and, a bit more recently, some better-than-expected employment news juxtaposed with a softer-than-expected GDP report. That begs the question: What about inflation? Isn’t that a key ingredient in the bond market mix?
Without a doubt, U.S. inflation data has taken a backseat for fixed income investors, and for good reason; there just haven’t been any fresh developments lately. Certainly, the conversation has shifted from a year ago, when deflation concerns were permeating market psychology. But the latest figures don’t elicit concerns that price pressures will be rearing their ugly head anytime soon, or at least that’s what the collective thinking is in the fixed income markets.
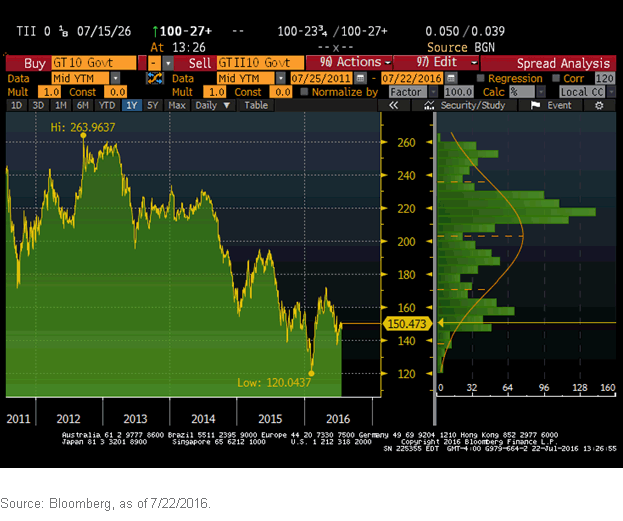
Breakeven Inflation Rate
 So, what does the inflation backdrop look like? According to the widely followed Consumer Price Index (CPI), the year-over-year inflation rate came in at +1.0% in June1—very little changed from the readings posted over the last four months, but definitely higher than the +0.1% for the same month in 2015. The core gauge, which excludes food and energy, rose at a +2.3% annual clip and has been residing in a range last seen in 2012. There continues to be a large dichotomy between core goods (-0.6%) and core services (+3.2%).2
As part of its dual mandate, the Federal Reserve (Fed) addresses inflation trends and its outlook in its FOMC meeting policy statements as well as focusing on expectations. In fact, inflation expectations play a pivotal role in the voting members’ deliberative process, because once a certain sentiment becomes embedded, it can become difficult to reverse. A primary way to gauge these expectations lies in what is known as “breakeven inflation rate.” This measure is the difference between the yield on a nominal bond (such as the U.S.Treasury 10-Year note) and an inflation-linked or real yield bond with the same maturity (such as the 10-Year U.S. Treasury Inflation-Protected Securities, or TIPS). This difference, or spread, is viewed as representing the expected rate of inflation. Utilizing our graph as a guide, the breakeven rate between the UST 10-Year yield (1.55%) and the UST 10-Year TIPS (0.05%) is 1.50%, not too far removed from the five-year low of 1.20% posted during this year’s peak “risk-off period,” and considerably below the high point of 2.64% registered in September 2012. In other words, expectations are for an inflation rate of roughly 1.5%, another factor that not only provides the Fed with no urgency to raise rates but also gives it time to continue to “closely monitor … global economic and financial developments.”3
Conclusion
Looking ahead, it seems more than likely that increasing price pressures are not building on the horizon. The effects of the prior strength in the U.S. dollar tend to lag and could continue to pass through and act as a drag on inflation. General economic slowing abroad, especially in China, may also weigh on prices in the goods sector. The Fed’s preferred gauge, the core PCE price index, has been running at a +1.6%4 annual rate the prior four months and does not look poised to hit the policy makers’ +2% threshold in 2016.
1Source: Bureau of Labor Statistics, as of 7/15/2016.
2Source: Bureau of Labor Statistics, as of 7/15/2016.
3Source: Federal Reserve as of 7/27/2016.
4Bureau of Economic Analysis as of 8/2/2016.
So, what does the inflation backdrop look like? According to the widely followed Consumer Price Index (CPI), the year-over-year inflation rate came in at +1.0% in June1—very little changed from the readings posted over the last four months, but definitely higher than the +0.1% for the same month in 2015. The core gauge, which excludes food and energy, rose at a +2.3% annual clip and has been residing in a range last seen in 2012. There continues to be a large dichotomy between core goods (-0.6%) and core services (+3.2%).2
As part of its dual mandate, the Federal Reserve (Fed) addresses inflation trends and its outlook in its FOMC meeting policy statements as well as focusing on expectations. In fact, inflation expectations play a pivotal role in the voting members’ deliberative process, because once a certain sentiment becomes embedded, it can become difficult to reverse. A primary way to gauge these expectations lies in what is known as “breakeven inflation rate.” This measure is the difference between the yield on a nominal bond (such as the U.S.Treasury 10-Year note) and an inflation-linked or real yield bond with the same maturity (such as the 10-Year U.S. Treasury Inflation-Protected Securities, or TIPS). This difference, or spread, is viewed as representing the expected rate of inflation. Utilizing our graph as a guide, the breakeven rate between the UST 10-Year yield (1.55%) and the UST 10-Year TIPS (0.05%) is 1.50%, not too far removed from the five-year low of 1.20% posted during this year’s peak “risk-off period,” and considerably below the high point of 2.64% registered in September 2012. In other words, expectations are for an inflation rate of roughly 1.5%, another factor that not only provides the Fed with no urgency to raise rates but also gives it time to continue to “closely monitor … global economic and financial developments.”3
Conclusion
Looking ahead, it seems more than likely that increasing price pressures are not building on the horizon. The effects of the prior strength in the U.S. dollar tend to lag and could continue to pass through and act as a drag on inflation. General economic slowing abroad, especially in China, may also weigh on prices in the goods sector. The Fed’s preferred gauge, the core PCE price index, has been running at a +1.6%4 annual rate the prior four months and does not look poised to hit the policy makers’ +2% threshold in 2016.
1Source: Bureau of Labor Statistics, as of 7/15/2016.
2Source: Bureau of Labor Statistics, as of 7/15/2016.
3Source: Federal Reserve as of 7/27/2016.
4Bureau of Economic Analysis as of 8/2/2016.
Important Risks Related to this Article
Fixed income investments are subject to interest rate risk; their value will normally decline as interest rates rise. In addition, when interest rates fall, income may decline. Fixed income investments are also subject to credit risk, the risk that the issuer of a bond will fail to pay interest and principal in a timely manner or that negative perceptions of the issuer’s ability to make such payments will cause the price of that bond to decline.
Share & Comment
Popular Posts
Categories
Related Links
About the Contributor
Head of Fixed Income Strategy
As part of WisdomTree’s Investment Strategy group, Kevin serves as Head of Fixed Income Strategy. In this role, he contributes to the asset allocation team, writes fixed income-related content and travels with the sales team, conducting client-facing meetings and providing expertise on WisdomTree’s existing and future bond ETFs. In addition, Kevin works closely with the fixed income team. Prior to joining WisdomTree, Kevin spent 30 years at Morgan Stanley, where he was Managing Director and Chief Fixed Income Strategist for Wealth Management. He was responsible for tactical and strategic recommendations and created asset allocation models for fixed income securities. He was a contributor to the Morgan Stanley Wealth Management Global Investment Committee, primary author of Morgan Stanley Wealth Management’s monthly and weekly fixed income publications, and collaborated with the firm’s Research and Consulting Group Divisions to build ETF and fund manager asset allocation models. Kevin has an MBA from Pace University’s Lubin Graduate School of Business, and a B.S in Finance from Fairfield University.
Follow Kevin Flanagan
@KevinFlanaganWT