
Dividends: The Foundation of the Smart Beta Movement


 Smart Beta Strategies That Access Multiple Drivers of Returns
Another consequence of our focus on dividends is exposure to multiple distinct return premiums—such as value, quality and low volatility. These types of factor tools have been popular of late, now that implementation tools readily exist. However, who would have anticipated that:
• 2015 was the year of growth and momentum—so much so that Facebook, Amazon, Netflix and Google, the so-called FANG6 stocks, came into prominence.
• With a simple flip of the calendar, value and lower volatility came back into favor at the start of 2016.
The high-level benefits of our approach to dividends include:
• Broadly inclusive nature that has exhibited a high correlation to established index benchmarks—especially value index benchmarks.
• Exposure to more precise size-cuts. These strategies do not introduce small-cap or mid-cap bias through their selection and weighting mechanisms.
• Sensitivity to the quality premium. Especially in the United States, there is a signaling aspect to firms declaring a regular dividend, insofar as the belief exists that it can be maintained over time.
• Exposure to the low-volatility premium. Going back nearly 10 years, it is not uncommon that our broad-based dividend strategies tend to have betas of .85 to .95 when measured against their market capitalization-weighted benchmarks.
While individual factors may come in and out of favor, strategies that combine exposure to multiple drivers of return may be more consistent over time.
1Source: Aniket Ullal “A Review of ETF Launches in 2015,” Nasdaq, 1/11/16.
2Source: Attracta Mooney “Smart Beta ‘Could Go Horribly Wrong’”, Financial Times, 2/22/2016.
3Source: Robert Dubil, “How Dumb Is Smart Beta? Analyzing the Growth of Fundamental Indexing,” Journal of Financial Planning, 28 (3): 49–54.
4Source: Ben Johnson, “Not All Dividend ETFs Are Created Equal,” Morningstar, 4/1/15.
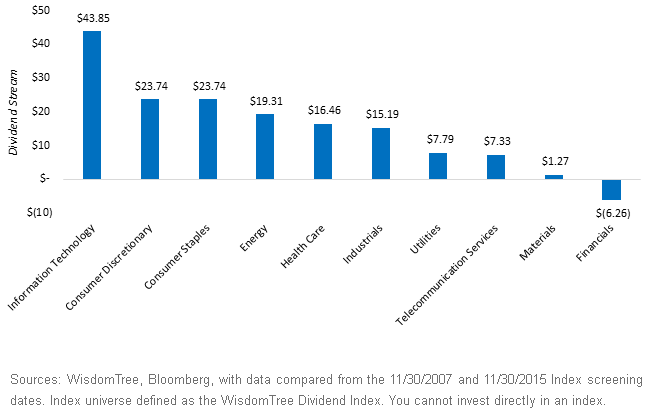
5Sources: WisdomTree, Bloomberg, with data as of 11/30/15 Index screening.
6Chris Ciaccia, “What Are FANG Stocks and Why Does Jim Cramer Love Them?,” TheStreet.com, 7/24/15.
Smart Beta Strategies That Access Multiple Drivers of Returns
Another consequence of our focus on dividends is exposure to multiple distinct return premiums—such as value, quality and low volatility. These types of factor tools have been popular of late, now that implementation tools readily exist. However, who would have anticipated that:
• 2015 was the year of growth and momentum—so much so that Facebook, Amazon, Netflix and Google, the so-called FANG6 stocks, came into prominence.
• With a simple flip of the calendar, value and lower volatility came back into favor at the start of 2016.
The high-level benefits of our approach to dividends include:
• Broadly inclusive nature that has exhibited a high correlation to established index benchmarks—especially value index benchmarks.
• Exposure to more precise size-cuts. These strategies do not introduce small-cap or mid-cap bias through their selection and weighting mechanisms.
• Sensitivity to the quality premium. Especially in the United States, there is a signaling aspect to firms declaring a regular dividend, insofar as the belief exists that it can be maintained over time.
• Exposure to the low-volatility premium. Going back nearly 10 years, it is not uncommon that our broad-based dividend strategies tend to have betas of .85 to .95 when measured against their market capitalization-weighted benchmarks.
While individual factors may come in and out of favor, strategies that combine exposure to multiple drivers of return may be more consistent over time.
1Source: Aniket Ullal “A Review of ETF Launches in 2015,” Nasdaq, 1/11/16.
2Source: Attracta Mooney “Smart Beta ‘Could Go Horribly Wrong’”, Financial Times, 2/22/2016.
3Source: Robert Dubil, “How Dumb Is Smart Beta? Analyzing the Growth of Fundamental Indexing,” Journal of Financial Planning, 28 (3): 49–54.
4Source: Ben Johnson, “Not All Dividend ETFs Are Created Equal,” Morningstar, 4/1/15.
5Sources: WisdomTree, Bloomberg, with data as of 11/30/15 Index screening.
6Chris Ciaccia, “What Are FANG Stocks and Why Does Jim Cramer Love Them?,” TheStreet.com, 7/24/15. Important Risks Related to this Article
Dividends are not guaranteed and a company currently paying dividends may cease paying dividends at any time.
Share & Comment
Popular Posts
Categories
Related Links
Christopher Gannatti began at WisdomTree as a Research Analyst in December 2010, working directly with Jeremy Schwartz, CFA®, Director of Research. In January of 2014, he was promoted to Associate Director of Research where he was responsible to lead different groups of analysts and strategists within the broader Research team at WisdomTree. In February of 2018, Christopher was promoted to Head of Research, Europe, where he was based out of WisdomTree’s London office and was responsible for the full WisdomTree research effort within the European market, as well as supporting the UCITs platform globally. In November 2021, Christopher was promoted to Global Head of Research, now responsible for numerous communications on investment strategy globally, particularly in the thematic equity space. Christopher came to WisdomTree from Lord Abbett, where he worked for four and a half years as a Regional Consultant. He received his MBA in Quantitative Finance, Accounting, and Economics from NYU’s Stern School of Business in 2010, and he received his bachelor’s degree from Colgate University in Economics in 2006. Christopher is a holder of the Chartered Financial Analyst Designation.