The Challenge for Active Managers in U.S. Mid Caps


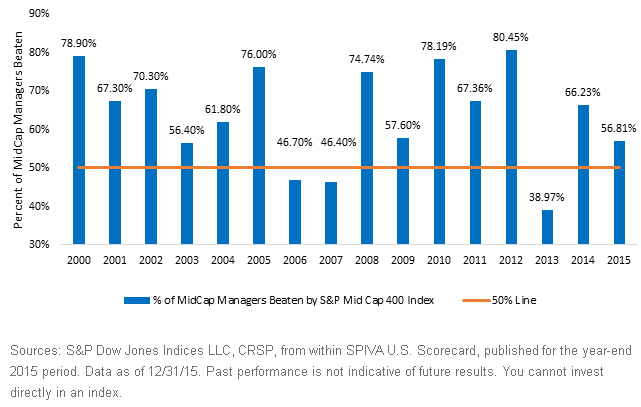
 Being an active mid-cap manager in U.S. equities has clearly been challenging. Attempting to select mid-cap managers who have remained open and are poised to outperform is also notably challenging.
WisdomTree Picks Up the Gauntlet
Any asset manager wants to show performance that is better than what clients may logically define as a market benchmark. One strategy may be to select a “lower quality” benchmark, but as shown from the performance record above, the S&P MidCap 400 Index would not be such a benchmark.
Of course, the other option is to design a methodology or investment strategy that can actually outperform a more difficult benchmark such as the S&P MidCap 400 Index.
Fully Transparent, Rules-Based Methodology for U.S. Mid-Caps
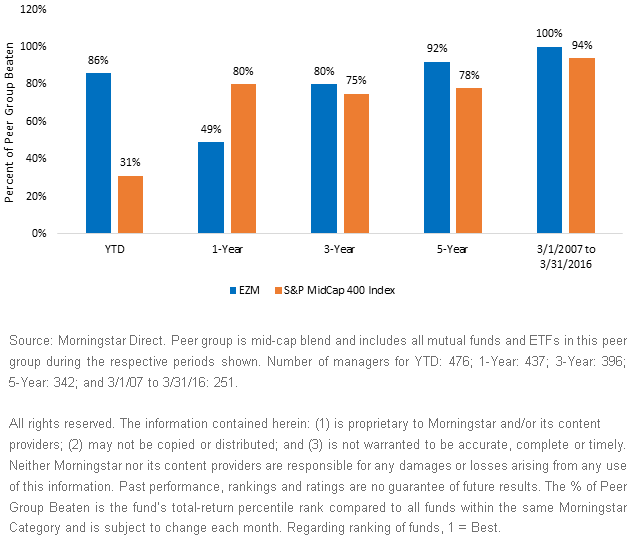
Our fully transparent, rules-based methodology that rebalances annually was able to beat the S&P MidCap 400 Index, after fees, over the standardized periods spanning nearly 10 years. It has no complicated stock selection—in fact, compared to the so-called “smart beta” indexes we’ve seen, this is on the more basic end of the spectrum.
The WisdomTree MidCap Earnings Fund (EZM) is designed to track the performance of the WisdomTree MidCap Earnings Index, before fees. This strategy:
1. Finds all profitable companies in U.S. equity markets
2. Defines the mid-cap universe, zeroing in on the majority of exposure between $2 billion and $10 billion in market capitalization
3. Weights this mid-cap universe by the Earnings Stream—in other words, the companies generating the greatest profits receive the most weight
4. Repeats this process annually
Performance against Mid-Cap Managers & ETFs
 Click here for standardized performance of EZM.
Generating This Impressive Performance
Of course, even with EZM’s incredible ranking against its peer group from March 1, 2007, to March 31, 2016, the approach did not generate as strong a ranking over each and every subperiod of this slightly more than nine-year span.
• Strong in Big Up Markets: 2009 and 2013 were examples of years that U.S. equities performed very strongly. In both of these years, EZM performed strongly and captured this upward trend. This contrasts with dividend-focused U.S. strategies that may not perform as strongly in up markets.
• Approaches like those taken by the WisdomTree MidCap Earnings strategy have the potential to steer around issues had by firms that have not been able to demonstrate profitability. That being said, during periods in which these more speculative firms perform well—which does occur—this strategy may not perform as strongly on a relative basis.
Raising the Bar for Active Managers
People considering mid-cap strategies may consider adding EZM to any of their investment screens, which, in any case, would raise the performance bar for mid-cap active managers.
Important Risks Related to this Article
There are risks associated with investing, including possible loss of principal. Funds focusing their investments on certain sectors and/or smaller companies may be more vulnerable to any single economic or regulatory development. This may result in greater share price volatility. Please read the Fund’s prospectus for specific details regarding the Fund’s risk profile.

Christopher Gannatti began at WisdomTree as a Research Analyst in December 2010, working directly with Jeremy Schwartz, CFA®, Director of Research. In January of 2014, he was promoted to Associate Director of Research where he was responsible to lead different groups of analysts and strategists within the broader Research team at WisdomTree. In February of 2018, Christopher was promoted to Head of Research, Europe, where he was based out of WisdomTree’s London office and was responsible for the full WisdomTree research effort within the European market, as well as supporting the UCITs platform globally. In November 2021, Christopher was promoted to Global Head of Research, now responsible for numerous communications on investment strategy globally, particularly in the thematic equity space. Christopher came to WisdomTree from Lord Abbett, where he worked for four and a half years as a Regional Consultant. He received his MBA in Quantitative Finance, Accounting, and Economics from NYU’s Stern School of Business in 2010, and he received his bachelor’s degree from Colgate University in Economics in 2006. Christopher is a holder of the Chartered Financial Analyst Designation.

