
Short Term Funding Markets: Let’s Put It in Perspective


02/25/2016
With 2016 getting off to a rather inauspicious start, it was natural for investors to feel increasingly anxious. Given the recent history of the financial crisis/great recession, as well as the eurozone’s “Grexit” events, questions have arisen as to where this latest experience might take us.
Being students of history ourselves, we have returned to the “playbook” that served as a very useful guide during the times of the aforementioned stresses: the short-term funding markets. Rather than focusing exclusively on equity valuations and credit spreads, it is also very important to pay close attention to what is going on in the arena where banks are funding themselves on a more short-term basis. The preferred gauge to measure potential credit risk on this front is the LIBOR–OIS spread.
To better understand this spread, let’s take a look at the two components. LIBOR is the average rate that major banks offer to lend to each other for short-term unsecured funds in a particular currency for a particular maturity in the wholesale money market in London. It can range from overnight to one year and is utilized as a benchmark for various loans and in the capital markets. OIS is an interest rates swap that consists of both a fixed and a floating rate component. The floating rate part uses an overnight rate index, in the case of the U.S. dollar the Federal Funds Rate , while the fixed portion is set at an agreed-upon rate between the two parties. Thus, the OIS is considered a proxy for Fed Funds. The LIBOR–OIS spread itself represents the difference between these two instruments and measures one that could contain potential credit risk (LIBOR) versus one that essentially does not (Fed Funds). A widening spread is considered a sign that there are stresses in the short-term bank funding markets.
3-Month LIBOR—OIS Spread
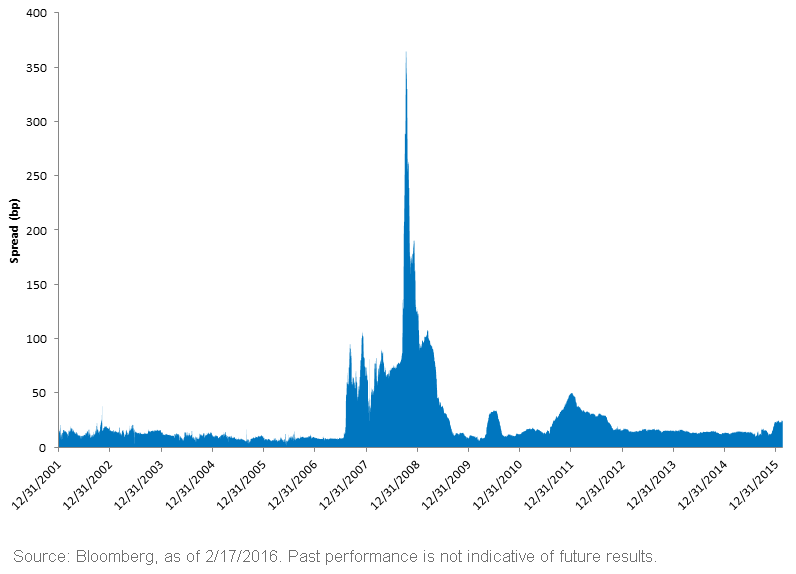 The more closely watched gauge is the 3-month LIBOR–OIS spread. The graph clearly reveals that, prior to the financial crisis and subsequent great recession, the spread was narrow. In fact, between December 2001 and July 2007, the mean (or average) differential was a modest 11 basis points (bps), and at one point in 2006 reached a low point of only about 2 bps. The first signs of stress in the funding markets appeared in the summer of 2007, and the average during the July 2007 to December 2009 period subsequently shot up to 75 bps. Underscoring the fears at that time, the spread built up to a crescendo in the fall of 2008 reaching an unbelievable peak of 364 bps in October of that year. The next episode of visible stress occurred during the December 2010 to December 2012 timeframe, when the eurozone’s woes were making frontpage headlines. It is interesting to note, though, that the levels that were observed then did not come close to the financial crisis/great recession readings; but when compared to what transpired prior to that highly charged period, the differential was still noticeably elevated. To illustrate, the mean spread over these two years registered at 26 bps and reached a high point of 50 bps in January 2012.
Conclusion
So, where do we stand early in 2016? Following a period of relative calm during 2014 and 2015, the average spread has risen by 10 bps and as of this writing stands at 24bp, or only a couple of basis points below the mean from 2011 to 2012. For the record, the range has been on the tight side, but still elevated between 22 bps and 25 bps. The bottom line is that some stress has resurfaced in the short-term funding arena, which does bear watching, but it has not yet risen to the prior episodes of strain.
The more closely watched gauge is the 3-month LIBOR–OIS spread. The graph clearly reveals that, prior to the financial crisis and subsequent great recession, the spread was narrow. In fact, between December 2001 and July 2007, the mean (or average) differential was a modest 11 basis points (bps), and at one point in 2006 reached a low point of only about 2 bps. The first signs of stress in the funding markets appeared in the summer of 2007, and the average during the July 2007 to December 2009 period subsequently shot up to 75 bps. Underscoring the fears at that time, the spread built up to a crescendo in the fall of 2008 reaching an unbelievable peak of 364 bps in October of that year. The next episode of visible stress occurred during the December 2010 to December 2012 timeframe, when the eurozone’s woes were making frontpage headlines. It is interesting to note, though, that the levels that were observed then did not come close to the financial crisis/great recession readings; but when compared to what transpired prior to that highly charged period, the differential was still noticeably elevated. To illustrate, the mean spread over these two years registered at 26 bps and reached a high point of 50 bps in January 2012.
Conclusion
So, where do we stand early in 2016? Following a period of relative calm during 2014 and 2015, the average spread has risen by 10 bps and as of this writing stands at 24bp, or only a couple of basis points below the mean from 2011 to 2012. For the record, the range has been on the tight side, but still elevated between 22 bps and 25 bps. The bottom line is that some stress has resurfaced in the short-term funding arena, which does bear watching, but it has not yet risen to the prior episodes of strain.
Share & Comment
Popular Posts
Categories
Related Links
About the Contributor
Head of Fixed Income Strategy
As part of WisdomTree’s Investment Strategy group, Kevin serves as Head of Fixed Income Strategy. In this role, he contributes to the asset allocation team, writes fixed income-related content and travels with the sales team, conducting client-facing meetings and providing expertise on WisdomTree’s existing and future bond ETFs. In addition, Kevin works closely with the fixed income team. Prior to joining WisdomTree, Kevin spent 30 years at Morgan Stanley, where he was Managing Director and Chief Fixed Income Strategist for Wealth Management. He was responsible for tactical and strategic recommendations and created asset allocation models for fixed income securities. He was a contributor to the Morgan Stanley Wealth Management Global Investment Committee, primary author of Morgan Stanley Wealth Management’s monthly and weekly fixed income publications, and collaborated with the firm’s Research and Consulting Group Divisions to build ETF and fund manager asset allocation models. Kevin has an MBA from Pace University’s Lubin Graduate School of Business, and a B.S in Finance from Fairfield University.
Follow Kevin Flanagan
@KevinFlanaganWT