Considerations for the “Forgotten Size Segment”: Mid Caps


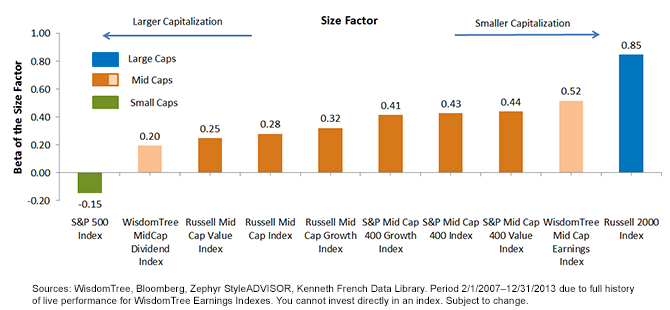
 For definitions of indexes in the chart, please visit our glossary.
• Fundamentally-Weighted “Book-Ends”: It’s interesting that the WisdomTree MidCap Dividend Index (WTMDI) is the largest mid-cap Index shown, whereas the WisdomTree MidCap Earnings Index (WTMEI) is the smallest. Size factors of 0.20 to 0.52 represent a wide variation in size exposure, in our opinion, and therefore very different potential risk and return characteristics. Even within the market capitalization-weighted peers, the S&P MidCap 400 Index’s small-cap tilt was more than 50% greater with its size loading factor of 0.43, compared to 0.28 for the Russell Midcap Index.
• “Book-Ends” Offer a Size Exposure that Is Materially Different from the Large and Small Caps: While the S&P 500 (large cap) and the Russell 2000 (small cap) have size factors at opposite ends of the spectrum (at -0.15 and 0.85, respectively), the mid-cap indexes occupy a notably different niche, with factors that range from 0.2 to 0.52. This suggests that mid-caps potentially offer a different return experience than their large- and small-cap peers.
• Blends Worth Considering: Based on these figures, a blend of approximately 75% WTMDI and 25% WTMEI would match the size factor of the Russell Midcap Index, whereas a blend of approximately 72% WTMEI and 28% WTMDI would match the size factor of the S&P MidCap 400 Index. These are very different portfolios, which helps us emphasize that benchmark selection is very important when considering mid-cap equities in the U.S.
Having discussed the unique ways of accessing mid-caps and how different the size factor exposure can be across index families, let’s turn to the larger question of how much of a total portfolio should be allocated to mid-caps. One framework to answer this question begins with the Russell 3000 Index as of December 31, 2013, and cuts the exposure as follows. Approximate weights:
• Large caps: Over $10 billion in market capitalization (78.4% weight)
• Mid-caps: Between $2 billion and $10 billion in market capitalization (16.4% weight)
• Small caps: Below $2 billion in market capitalization (5.2% weight)
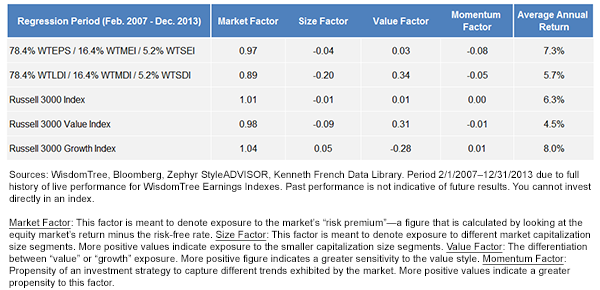
We ran a factor analysis that combines this portfolio allocation to WisdomTree Large-, Mid- and SmallCap Indexes in the same proportions as large, mid- and small caps appear in the Russell 3000 Index. The resulting factor exposures are listed in the table below.
Building Exposure to the Market Capitalization Size Spectrum
 • Dividend Blend: Simply put, the major attributes of the dividend blend, compared to the Russell 3000 Index, are 1) lower beta, 2) exposure to larger companies, and 3) a greater tilt toward the value style that is largely similar to the Russell 3000 Value Index.
• Earnings Blend: The major attributes of the earnings blend, compared the Russell 3000 Index, are 1) slightly lower beta, 2) very similar size, and 3) very similar “core” allocation with a value factor similar to the Russell 3000 Index (core). The crucial point is that all of this was accomplished with nearly 100 basis points of incremental average annual performance.
Conclusion
In our research on smart beta, we used a factor model analysis to describe the exposure inherent in WisdomTree’s Index methodology. We believe a critical part of evaluating the smart beta approach is taking a look under the hood of the strategies. We hope this research and blog series helped frame why and how WisdomTree’s U.S. Index family achieved the results it did over the real-time period analyzed.
1Source: Eugene F. Fama and Kenneth R. French, “Size, Value, and Momentum in International Stock Returns,” 6/21/11.
• Dividend Blend: Simply put, the major attributes of the dividend blend, compared to the Russell 3000 Index, are 1) lower beta, 2) exposure to larger companies, and 3) a greater tilt toward the value style that is largely similar to the Russell 3000 Value Index.
• Earnings Blend: The major attributes of the earnings blend, compared the Russell 3000 Index, are 1) slightly lower beta, 2) very similar size, and 3) very similar “core” allocation with a value factor similar to the Russell 3000 Index (core). The crucial point is that all of this was accomplished with nearly 100 basis points of incremental average annual performance.
Conclusion
In our research on smart beta, we used a factor model analysis to describe the exposure inherent in WisdomTree’s Index methodology. We believe a critical part of evaluating the smart beta approach is taking a look under the hood of the strategies. We hope this research and blog series helped frame why and how WisdomTree’s U.S. Index family achieved the results it did over the real-time period analyzed.
1Source: Eugene F. Fama and Kenneth R. French, “Size, Value, and Momentum in International Stock Returns,” 6/21/11.Important Risks Related to this Article
Investments focusing on certain sectors and/or smaller companies increase their vulnerability to any single economic or regulatory development. This may result in greater share price volatility. Dividends are not guaranteed and a company’s future abilities to pay dividends may be limited. A company currently paying dividends may cease paying dividends at any time. The Dow Jones U.S. Select Dividend Index is calculated, distributed and marketed by Dow Jones Indexes, a licensed trademark of CME Group Index Services LLC, and has been licensed for use.

Jeremy Schwartz has served as our Global Chief Investment Officer since November 2021 and leads WisdomTree’s investment strategy team in the construction of WisdomTree’s equity Indexes, quantitative active strategies and multi-asset Model Portfolios. Jeremy joined WisdomTree in May 2005 as a Senior Analyst, adding Deputy Director of Research to his responsibilities in February 2007. He served as Director of Research from October 2008 to October 2018 and as Global Head of Research from November 2018 to November 2021. Before joining WisdomTree, he was a head research assistant for Professor Jeremy Siegel and, in 2022, became his co-author on the sixth edition of the book Stocks for the Long Run. Jeremy is also co-author of the Financial Analysts Journal paper “What Happened to the Original Stocks in the S&P 500?” He received his B.S. in economics from The Wharton School of the University of Pennsylvania and hosts the Wharton Business Radio program Behind the Markets on SiriusXM 132. Jeremy is a member of the CFA Society of Philadelphia.

