Positioning for Economic Growth with Mid Cap Stocks


 Average Annual Returns (as of 6/30/2013)
 For definitions of indexes in the charts, please visit the Glossary.
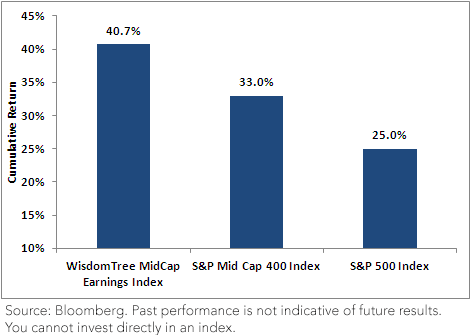
• MidCap Earnings Performed Strongly: Whether one looks at one-year, three-year, five-year or even since-inception returns, MidCap Earnings has done well compared to the S&P MidCap 400 Index (S&P 400) and the S&P 500 Index, possibly the most widely followed measure of U.S. equity market performance.
• Consumer Discretionary & Industrials: The changing tone coming out of the Federal Reserve could signal an improving economic picture for the U.S. If this is indeed the case, U.S. consumers may ultimately pick up their consumption. As of July 31, 2013, compared to the S&P 400, MidCap Earnings had an approximate 3.1% over-weight (16.6% vs. 13.5%) in the Consumer Discretionary sector and an approximate 2.3% over-weight (18.7% vs. 16.4%) in the Industrials sector.
This coincides with a broader measure of exposure to the more defensive sectors1 —sectors that generally underperform as economic growth rises and the economy improves. As of July 31, 2013, defensive sector exposure was at approximately 16.6% for MidCap Earnings and 19.4% for the S&P 400. As a point of reference, the S&P 500 Index’s exposure to defensive sectors was nearly 30% at the same point in time, and it helps to explain the relative performance differences over the one-year period described above.
Characterizing the Strong One-Year Performance
For the one-year period ending July 31, 2013, MidCap Earnings outperformed the S&P 400 by nearly 8% and the S&P 500 Index by almost 16%. We believe the two crucial questions are:
• What drove this outperformance?
• After such outperformance, are valuations becoming expensive?
Mid-Cap Stocks Deliver on a One-Year Basis
For the S&P 400, 9 out of 10 sectors delivered positive cumulative performance for the one-year period ending July 31, 2013. For MidCap Earnings, this figure is 10 out of 10. What this tells us is that, generally speaking, mid-cap stocks performed well over the past year. The main drivers of the MidCap Earnings outperformance were:
• Stock Selection: MidCap Earnings has a rebalancing process that, each year, refocuses solely on companies that were able to deliver positive profits for the year preceding the screening date, occurring annually on November 302 . This stock selection process contributed to the lion’s share of the nearly 8% outperformance compared to the S&P 400; being over- or under-weight in different sectors proved much less influential.
• Financials, Consumer Discretionary and Information Technology: It was in these three sectors that the MidCap Earnings stock selection added the most value compared to the S&P 400’s performance over the one-year period ending July 31, 2013. The differences in performance by sector (MidCap Earnings vs. S&P 400) were: Financials: 39.8% vs. 24.6%; Consumer Discretionary: 50.1% vs. 33.6%; Information Technology: 33.6% vs. 23.2%.
Valuation and the Importance of the Annual Rebalance
We all recognize that, at times, stocks or sectors can have a run of strong performance and then become more expensive relative to their fundamentals. Market capitalization-weighted indexes reward firms with higher market caps with greater weights—which means they tend to have greater weights in stocks that have recently performed strongly. Rebalancing back toward a fundamental factor—such as earnings—actually unlinks the share price from constituent weights in an index, in essence rewarding greater profit generators—rather than greater stock price performance—with higher weights. A potential result could be a lower valuation compared to a market capitalization-weighted approach.
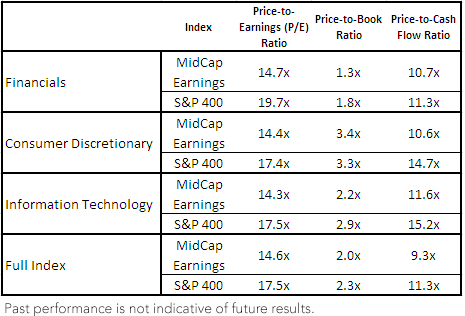
Utilizing the three sectors discussed earlier—Financials, Consumer Discretionary and Information Technology—as well as the indexes as a whole, let’s compare a few different valuation metrics:
MidCap Earnings vs. S&P 400 Valuation Metrics (as of 7/31/2013)
 For definitions of terms in the chart, please visit our Glossary.
In every metric except for one (Consumer Discretionary on a price-to-book ratio) MidCap Earnings exhibits a lower valuation than the S&P 400. Even though these sectors are the three most responsible for MidCap Earnings’ nearly 8% outperformance of the S&P 400 over the past year, it is difficult, based on these figures, to make the case that they are becoming “expensive.”
Moreover, we are more than halfway through the year. This Index will undergo a rules-based rebalancing process in December (based on a November 30 Index screening) to make adjustments to securities and their weights based on changes in relative value of the component securities. With the Index up 40% over the prior one-year period it will be a good year to make adjustments and reduce weight to those companies that have appreciated more than their underlying fundamentals (their Earnings Streams ) at the rebalance.
WisdomTree believes a disciplined process of rules-based rebalancing back to fundamentals is important, but it could be especially important in the mid-cap sector, given the large moves we have seen over the prior one-year period.
1Defensive sectors: Consumer Staples, Health Care, Telecommunication Services, Utilities.
2Specifically, positive cumulative core earnings for the four quarters preceding the Index screening date. Core earnings are a means to focus more on earnings from operations and less on earnings derived from one-time events, such as the sale of a subsidiary.
For definitions of terms in the chart, please visit our Glossary.
In every metric except for one (Consumer Discretionary on a price-to-book ratio) MidCap Earnings exhibits a lower valuation than the S&P 400. Even though these sectors are the three most responsible for MidCap Earnings’ nearly 8% outperformance of the S&P 400 over the past year, it is difficult, based on these figures, to make the case that they are becoming “expensive.”
Moreover, we are more than halfway through the year. This Index will undergo a rules-based rebalancing process in December (based on a November 30 Index screening) to make adjustments to securities and their weights based on changes in relative value of the component securities. With the Index up 40% over the prior one-year period it will be a good year to make adjustments and reduce weight to those companies that have appreciated more than their underlying fundamentals (their Earnings Streams ) at the rebalance.
WisdomTree believes a disciplined process of rules-based rebalancing back to fundamentals is important, but it could be especially important in the mid-cap sector, given the large moves we have seen over the prior one-year period.
1Defensive sectors: Consumer Staples, Health Care, Telecommunication Services, Utilities.
2Specifically, positive cumulative core earnings for the four quarters preceding the Index screening date. Core earnings are a means to focus more on earnings from operations and less on earnings derived from one-time events, such as the sale of a subsidiary.Important Risks Related to this Article
Investments focusing on certain sectors and/or smaller companies increase their vulnerability to any single economic or regulatory development. This may result in greater share price volatility.

Christopher Gannatti began at WisdomTree as a Research Analyst in December 2010, working directly with Jeremy Schwartz, CFA®, Director of Research. In January of 2014, he was promoted to Associate Director of Research where he was responsible to lead different groups of analysts and strategists within the broader Research team at WisdomTree. In February of 2018, Christopher was promoted to Head of Research, Europe, where he was based out of WisdomTree’s London office and was responsible for the full WisdomTree research effort within the European market, as well as supporting the UCITs platform globally. In November 2021, Christopher was promoted to Global Head of Research, now responsible for numerous communications on investment strategy globally, particularly in the thematic equity space. Christopher came to WisdomTree from Lord Abbett, where he worked for four and a half years as a Regional Consultant. He received his MBA in Quantitative Finance, Accounting, and Economics from NYU’s Stern School of Business in 2010, and he received his bachelor’s degree from Colgate University in Economics in 2006. Christopher is a holder of the Chartered Financial Analyst Designation.

