
Large-Cap Growth: Brace for Earnings Revisions


So much for crashes bringing valuations back to Earth.
Here we are in the middle of an economic depression—one that maybe that lasts a few months, or maybe one that goes on for a long while—and yet the Russell 1000 Growth Index is still trading for 27 times trailing earnings (figure 1).
Figure 1: Price-Earnings Ratio (Trailing 12 Months)
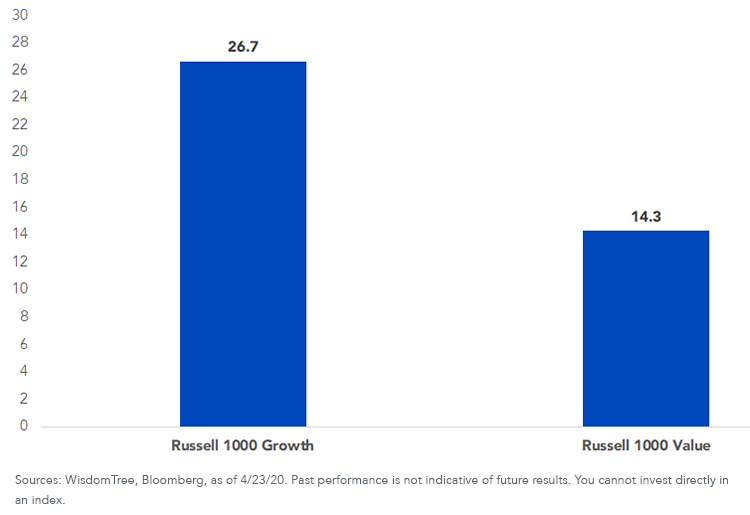
For definitions of the terms in the chart, please visit our glossary.
Why the robust valuations?
Because Wall Street still hasn’t gotten around to looking in the mirror when it comes to the beloved U.S. large-cap growth style investment box, the asset class that could do no wrong for the last decade.
Estimates from Bloomberg for the Russell 1000 Growth Index call for earnings to compound at a double-digit rate for 3 to 5 years—from a starting point of record pre-coronavirus earnings (figure 2).
Figure 2: Bloomberg Long-Term Operating Earnings Growth Estimate
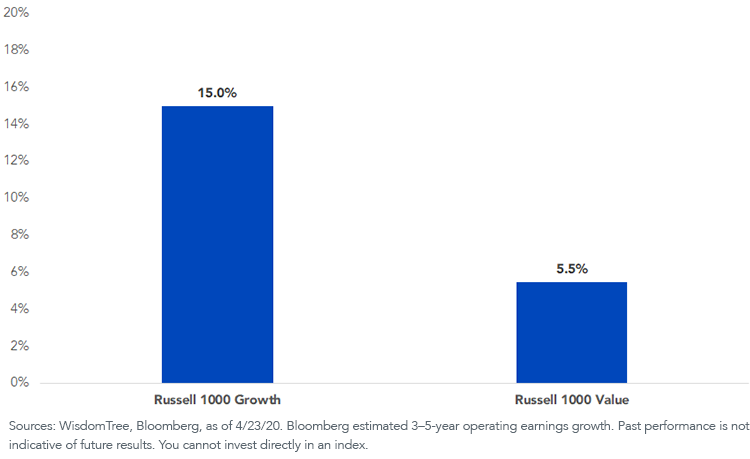
The thing about forecasted 15% earnings growth from now until 2023, 2024 or 2025, should that somehow come to pass, is that it would blow away historic precedent.
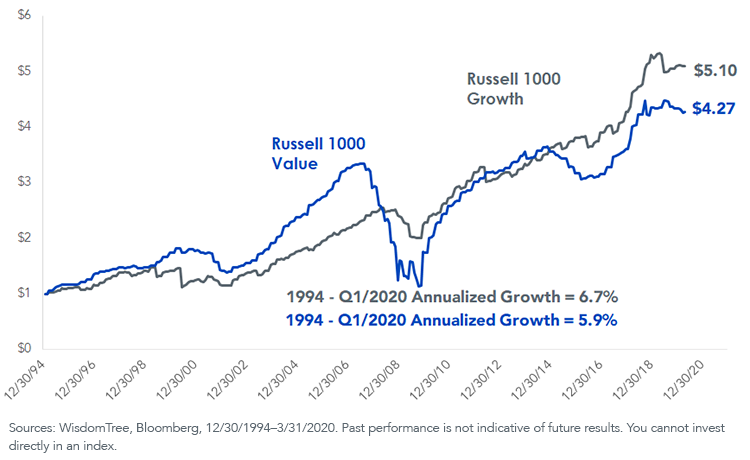
Going back to 1994, Russell 1000 Growth Index earnings increased at a 6.7% annualized clip, only slightly faster than the Russell 1000 Value Index’s 5.9% annual growth rate (figure 3). Relative to supposedly stodgy value stocks, the “growth” in growth stocks has largely been an illusion.
Figure 3: Growth of Earnings, U.S. Large Caps (12/30/94 = $1)
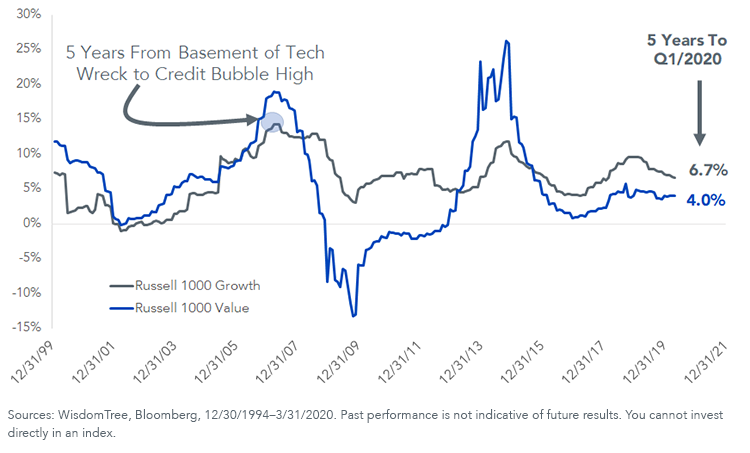
Coincidentally, in the five years to the first quarter of 2020—a period of economic expansion, not COVID-19-inspired malaise—the Russell 1000 Growth Index saw earnings increase at exactly the same pace as history: 6.7% annually (figure 4).
To grow 15% for several years from the current starting point is, let’s just say, a stretch.
Figure 4: 5-Year Annual Earnings Growth
Investors have found relative safety in growth stocks in 2020 on account of fears of economic contraction.
Interestingly, both the Russell 1000 Value Index and our main value index, the WisdomTree U.S. LargeCap Dividend Index, which weights stocks by their dividend as a proportion of the total dividend pie, grew earnings faster than the Russell 1000 Growth Index since the credit bubble (figure 5).
Figure 5: Calendar Year Index Earnings ($bn)
.png)
Logic says to brace for downside revisions to the market’s expectations for growth stocks in the coming years.
The Russell 1000 Growth Index is at 1,7111 and earned $62.42 in the year through March.
Earnings will decline from the economic shutdown; the question is how much.
But I wouldn’t hold my breath waiting for Russell 1000 Growth earnings of $95.02 by this time in 2023 or $125.75 in the first quarter of 2025 (figure 6). Such figures seem fantastical.
Figure 6: Russell 1000 Growth Index Earnings per Share (EPS)
.png)
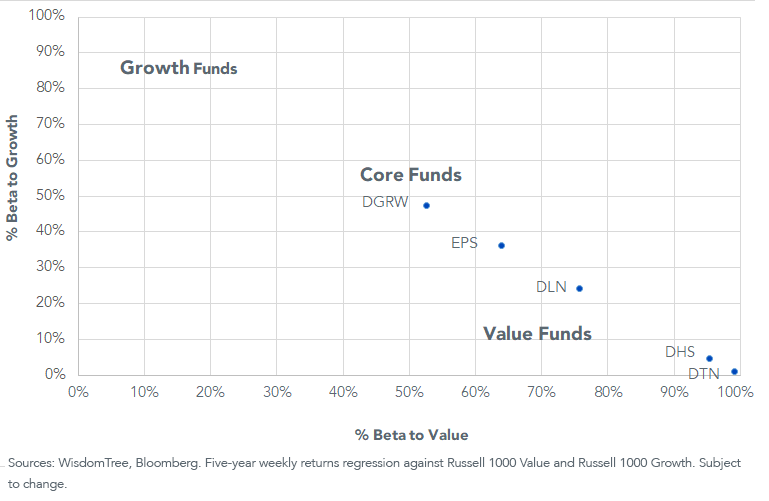
Figure 7 plots five WisdomTree ETFs on the growth-value spectrum:
DGRW (WisdomTree U.S. Quality Dividend Growth Fund)
EPS (WisdomTree U.S. LargeCap Fund)
DLN (WisdomTree U.S. LargeCap Dividend Fund)
DHS (WisdomTree U.S. High Dividend Fund)
DTN (WisdomTree U.S. Dividend ex-Financials Fund)
Figure 7: WisdomTree Returns Attribution
For definitions of terms in the chart, please visit our glossary.
Sooner or later, we believe the face of disappointment in this market will be in U.S. large-cap growth.
It will likely not be a one- or two-month problem either. It could be something akin to the seven-year struggle of growth stocks after the dot-com bubble started to unwind.
Let the spectrum chart in figure 7 be your guide as you engage our strategies.
Unless otherwise stated, data source is Bloomberg, as of 4/23/20.
1As of April 27, 2020
Important Risks Related to this Article
There are risks associated with investing, including the possible loss of principal. Foreign investing involves currency, political and economic risk. Funds focusing on a single country, sector and/or funds that emphasize investments in smaller companies may experience greater price volatility. Dividends are not guaranteed, and a company currently paying dividends may cease paying dividends at any time. Please see each Fund’s prospectus for a discussion of risks.
Share & Comment
Popular Posts
Categories
Related Links